Taylor’s Super Bowl vs. Taylor’s Concert: A Traffic Analysis
It turns out Taylor Swift’s concert at Allegiant caused more traffic than the Super Bowl. We unpack why, look at how Super Bowl traffic trends compare to other recent events, and use near real-time data to visualize exactly how traffic played out at streets around the stadium.

Jump Ahead
Last weekend’s Super Bowl was the most watched television event in history. At Allegiant Stadium in Las Vegas, it was also one of the biggest in-person events of the year for the city. The stadium itself has an extended capacity to accommodate over 70,000 game-goers, but that doesn’t account for the tailgaters and partygoers who attended events throughout the city before, during, and after the game.
For event operators and transportation agencies that also means the Super Bowl was one of the biggest traffic bottlenecks of the year. (And that’s without factoring in Taylor Swift’s travel from private jet to stadium arena.)
To understand how traffic trends played out and compare the impact against other recent major events at Allegiant, StreetLight used its Traffic Monitor product, equipped with real-time and historical speed and traffic activity data. Understanding these traffic patterns — which roadways see the most congestion and when — can help event operators study and improve traffic plans for events and construction projects.
In the gif below, you can see a time lapse of Super Bowl traffic around Allegiant Stadium during the 12 hours around the game.
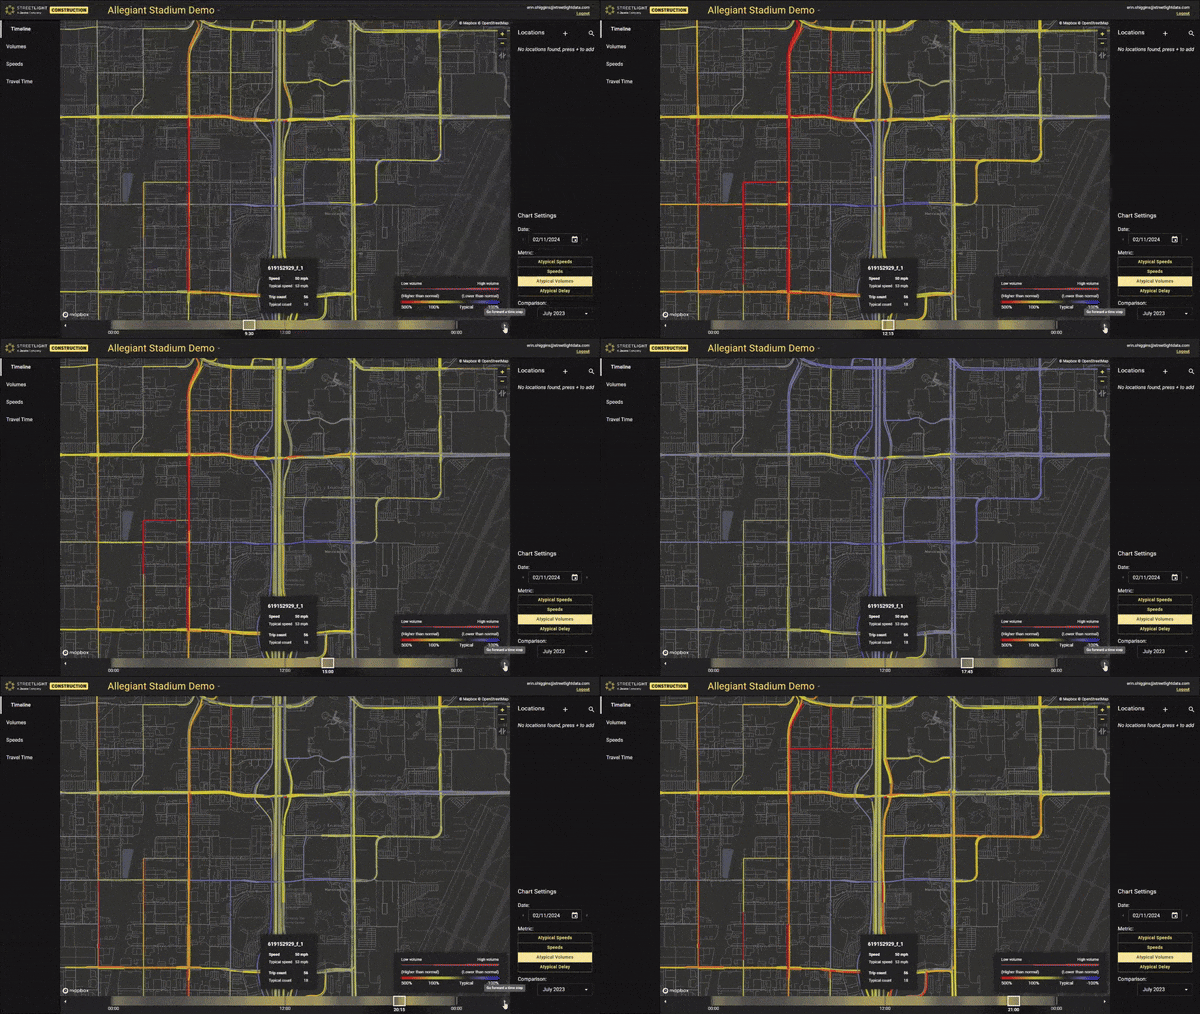
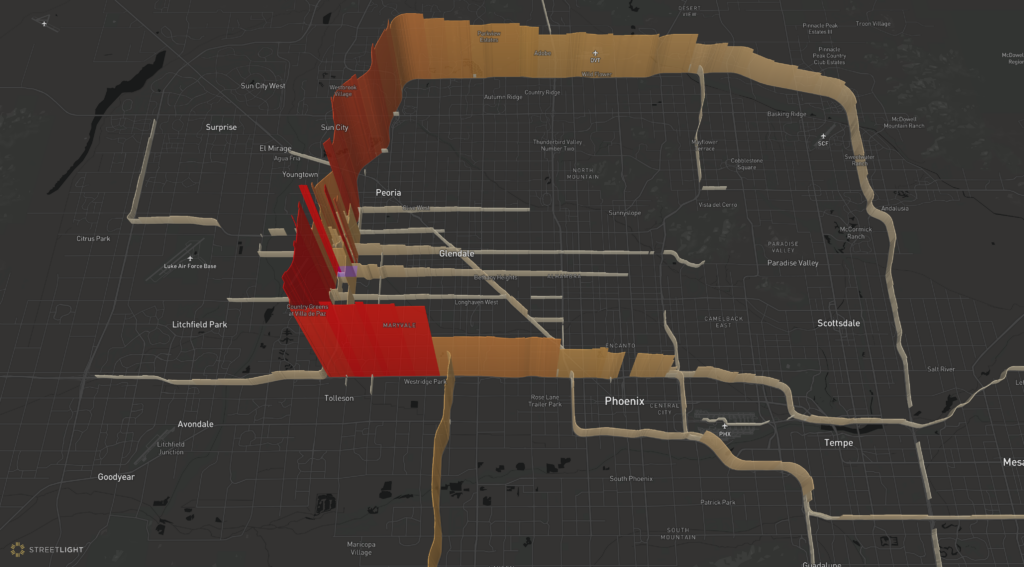
You can see how roadways build up atypical vehicle volumes (shown in gradient from yellow to red) throughout the day, ahead of the game start. But then, the gradient becomes light blue during the game itself, indicating lower than normal vehicle volumes. This is because vehicle volumes on roadways surrounding the stadium actually fell below normal during the game, as people stayed put both at the stadium or at their Super Bowl parties to watch the action. Volumes rise again, well above the pre-game volumes, after the game ends.
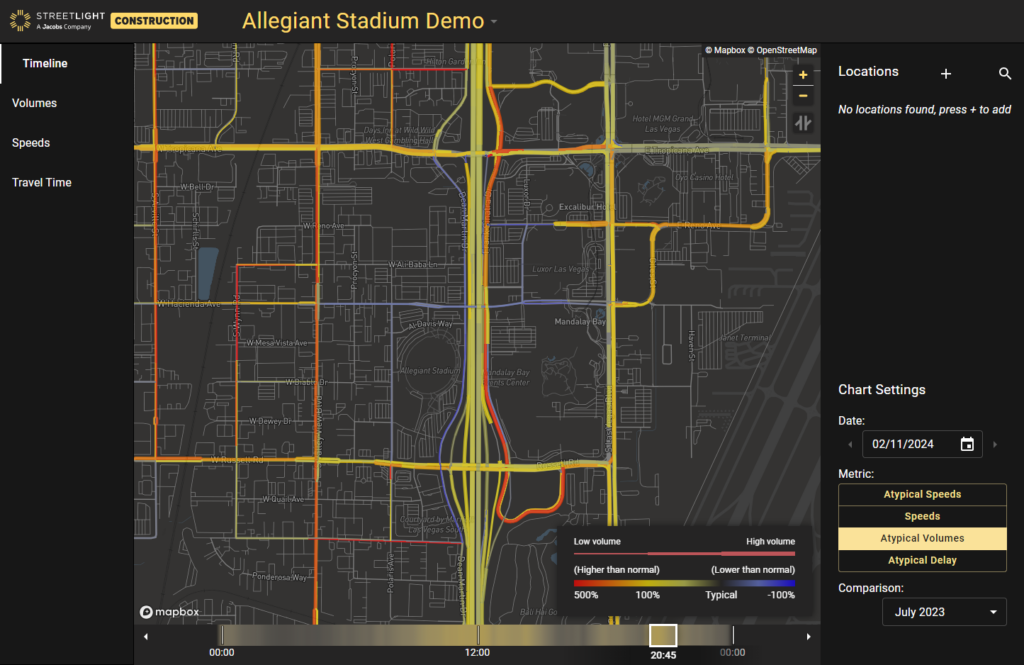
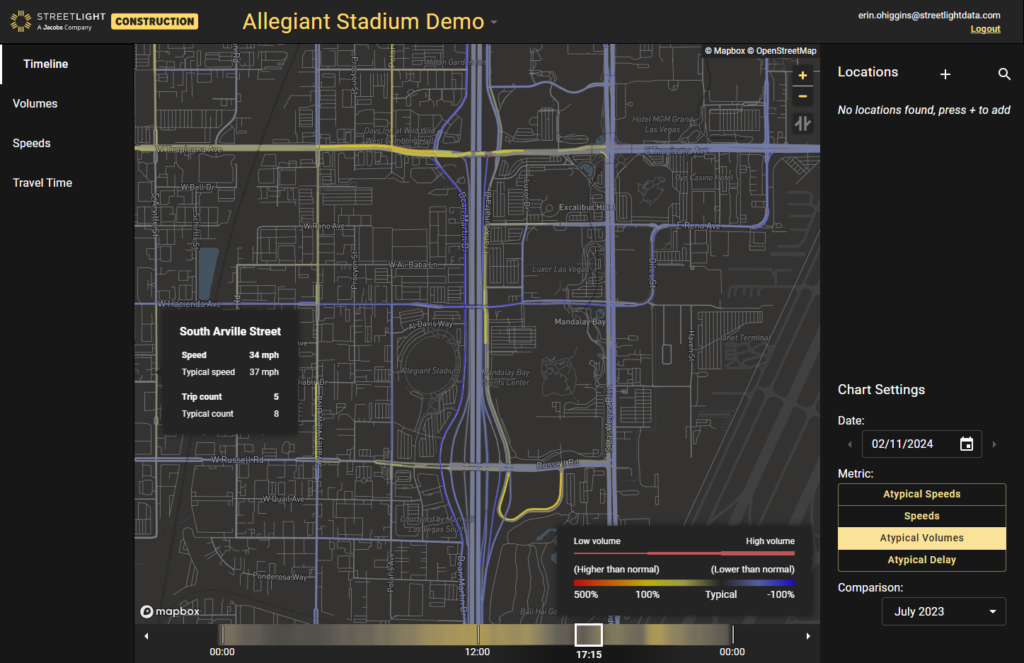
This is visible in starker relief in the screenshots below. in the first image, we see atypical volumes at the peak egress vs. the second image, where the roads are clearer than usual during the game.
Of course, events don’t take place in a vacuum and there may be unforeseen circumstances that further impact congestion. Las Vegas’ Super Bowl traffic offers an example of this as well.
Nearly simultaneous with the end of the Super Bowl and peak egress, a pole fell on the Las Vegas strip within 3 miles of Allegiant Stadium. StreetLight captured the impact of the incident on speeds on nearby roadways in the gif below.
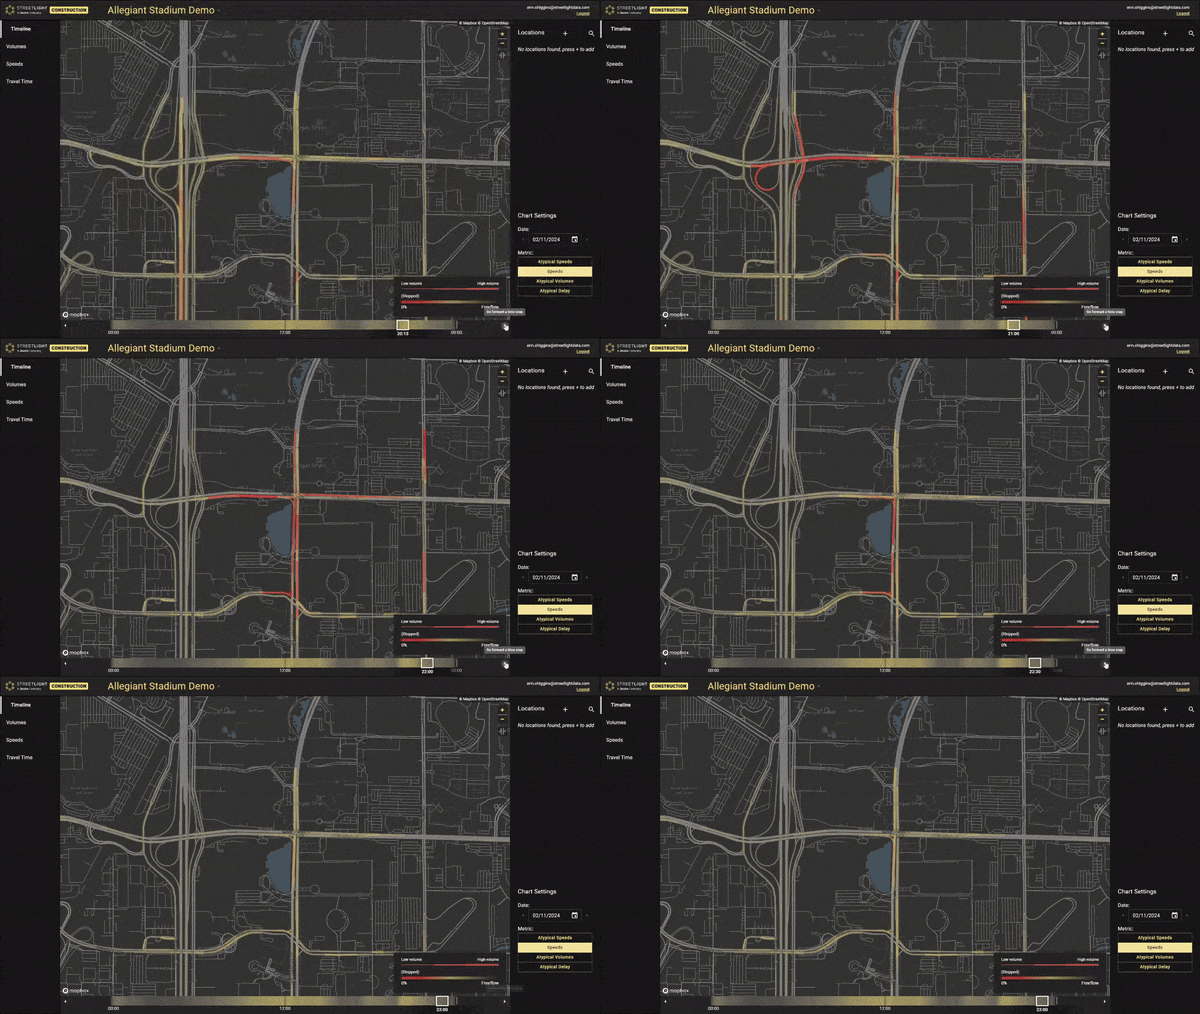
The pole incident further contributed to the Super Bowl traffic impact, as congestion moved away from the Stadium and towards post-game events throughout the city.
This is another important consideration for traffic planners and engineers: what will the impact look like should some an additional traffic incident occur, and where are the potential routes and detours that can help disgorge some of those impacts. This is why it is critical to pair near real-time data with historical data to dynamically adjust for typical vs. atypical circumstances.
Event Traffic Trends at Allegiant Stadium
Las Vegas is a town that regularly hosts major marquee national events. But traffic around the stadium still snarls from the impact of attendees. In fact, when StreetLight analyzed Taylor Swift’s Eras Tour, it found that Allegiant Stadium saw the greatest vehicle hours of delay of any of the stadiums studied.
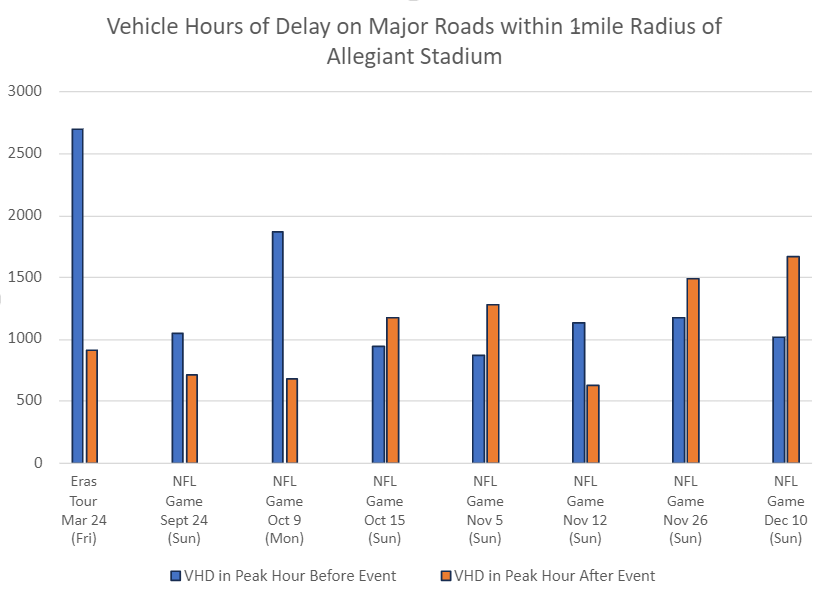
To get a high-level view of how congestion and traffic typically operates during events at Allegiant Stadium, StreetLight first measured Vehicle Hours of Delay within one mile of the stadium during peak arrival and peak departure hours at some recent events prior to the Super Bowl.
It’s clear that the timing of the events has a major impact on delays. Delays are much higher in the hour before the event when the event occurs on weekdays, likely because on these days there is higher typical congestion. Otherwise, egress is typically when there is the most concentrated congestion.
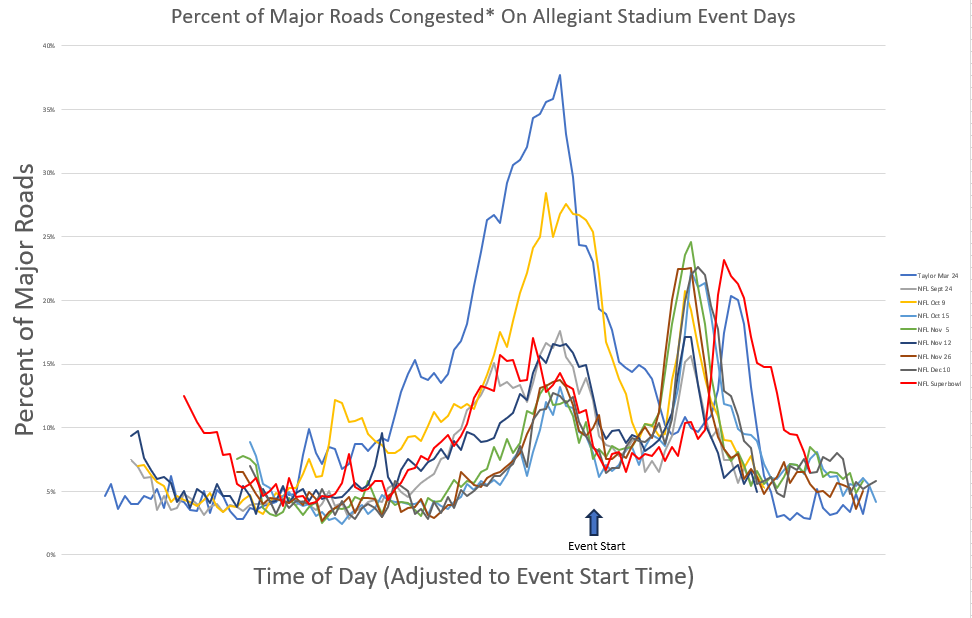
In the graphs below, StreetLight further analyzed major roads within a 3.5-mile radius of Allegiant at each of these events to understand the trajectory of roadway congestion during the 12 hours surrounding the events. StreetLight also used near real-time data to see these trends during the Super Bowl itself. The analysis measures the percentage of roadways with average speeds below 75% of typical free-flow speeds mapped over the 12 hours surrounding the 9 events and normalized for event start times.
Again, it’s evident how weekday events create much more congestion leading up to the event. In particular, Taylor Swift’s Friday concert dwarfs the other events for peak pre-event congestion, including the Super Bowl. Of course, that is in part driven by event excitement and fans arriving early to buy merchandise, but it is also likely a function of the Friday event time. The single NFL game studied on a weekday, the Monday Oct 9 game, sees the second highest congestion ahead of the event start, ahead of even the Super Bowl.
In fact, pre-event traffic to the Super Bowl follows very similar patterns to the other weekend games, although the period of sustained congestion is slightly longer and earlier than the other events.
The Super Bowl is also not a complete outlier for egress congestion, though traffic did push slightly later, perhaps due to the game going into overtime. Congestion is also sustained for a somewhat longer period during egress compared to all the other events. This could be a reflection of Super Bowl-specific attendance trends, the impact of the downed pole on the strip, and even increased traffic throughout the city as people outside the stadium also got back in their cars following the games.
To disentangle normal traffic patterns from event-induced traffic, StreetLight’s tool allows users to compare empirical speeds to free-flow speeds and typical speeds for a given corridor.
In the two charts below, StreetLight shows the differences in these measures across three of the events studied: Taylor Swift’s Friday concert, the Super Bowl, and another Sunday NFL game. The scale in the free-flow chart is higher because the percentage of congested roadways is higher when empirical speed is compared to free-flow speeds.

The spike in traffic from Taylor Swift’s Friday concert is more compressed when compared against normal speeds because this measure better accounts for existing weekday traffic. During egress, Swift’s concert and the Super Bowl look similar across both measures.
Solve congestion WITHOUT highway expansion
Get Congestion Solutions GuideBig Data for Special Events and Construction Traffic Operations
A big data approach to special events planning can help fill crucial data gaps to anticipate the traffic impact of special events and deploy rapid-response congestion mitigation measures during these events to ease clogged traffic.
Access to on-demand transportation analytics can be used to inform broader travel demand models, analyze past events to inform future event operations, and monitor ongoing events as they unfold. These kinds of insights are critical for dynamically adjusting plans and identifying safety concerns. And because analytics are accessed online, this can expedite special events planning without putting staff in harm’s way for manual counts and surveys that only capture a snapshot of traffic during a short period of time.
This expedited process allows planners and operators to proactively evaluate alternative traffic management strategies and communicate their decisions with the public in advance of special events.
Meanwhile, near real-time traffic data can help operations managers monitor traffic during an event and react quickly to congestion or safety concerns as they develop. Using near real-time data to create a high-level view of congestion throughout the roadway network over time (i.e. viewing a time lapse of traffic conditions like vehicle speeds) can help spotlight where capacity is strained and where there may be potential to reroute traffic to underutilized roadways.
Historical Traffic Data for Special Events Planning
Analyzing historical traffic data can help proactively plan special events traffic management. In particular, these metrics may be helpful:
- Traffic Volumes – to understand trends over time, identify when during the day traffic peaks, compare weekdays to weekends, and flag where road capacity may be insufficient and identify potential detours.
- Origin-Destination (O-D) and Routing – to understand where attendees tend to travel from, which roadways may become congested, and where traffic could be rerouted to less-used segments to ease traffic flow.
- Turning Movements – to pinpoint major intersections and road segments where people turn on their way into the event venue during typical conditions and special events.
- VHD – (Vehicle Hours of Delay) to understand how past events have impacted traffic congestion on roads near the venue, and how these conditions affect the larger roadway network.
- Travel Time – similar to VHD, travel time analyses can help planners understand how special events impact all road users (not just attendees) and inform public communications around expected delays.
- Vehicle Speeds – to evaluate safety conditions and crash risk near the venue, especially for vulnerable road users like pedestrians and cyclists.
- Bike and Pedestrian activity – to identify common historical walking and cycling routes to and from the venue.
These metrics allow planners to anticipate how traffic conditions will change during special events and prioritize traffic management strategies such as detours, signage, and signal timing that will keep traffic flowing and protect the safety of all road users.
For example, analyzing turning movements by time of day can reveal key intersections leading to the event venue that are well-timed for normal conditions, but stall traffic flow during major events. Planners may use these insights to temporarily retime signals on the day(s) of the event, or specifically during the hours that turning movements peak, to offer more opportunities for attendees to make their turns into and out of the venue. Similarly, planners can flag where event signage could be necessary to direct traffic away from residential or other local streets not suited for high-volume traffic.
Near Real-Time Traffic Data for Special Events and Construction Planning
Near real-time traffic data can be used to respond quickly to road conditions as they change, giving operations managers more insights into the specific tactics that can help mitigate congestion or safety concerns during the atypical traffic patterns that accompany major events like the Super Bowl or during significant construction projects.
For example, operations managers might notice major delays on a specific corridor leading into or out of an event venue. They might then analyze recent vehicle traffic activity on adjacent streets to see where rerouting cars could unjam traffic, or pinpoint the most congested intersections to deploy temporary traffic control personnel or retime smart traffic signals to improve traffic flow.
Analyzing near real-time vehicle speed and traffic flow metrics can also help operations managers pinpoint where pedestrians may face dangerous conditions, allowing them to deploy traffic calming measures quickly if needed.
Near real-time data can also be useful ahead of an event or major construction to understand the most recent traffic trends and inform communications with the public regarding expected delays or detours. This can be especially impactful if there have been recent design changes to nearby roads or the venue itself that may impact traffic flow patterns.
To learn more about leveraging big data for special event, construction, and other traffic operations management, check out our Traffic Engineering and Operations Solutions.
Start exploring local traffic trends with a free trial of StreetLight's AADT metrics
Request your Free TrialReady to dive deeper and join the conversation?
Explore the resources listed above and don’t hesitate to reach out if you have any questions. We’re committed to fostering a collaborative community of transportation professionals dedicated to building a better future for our cities and communities.