How to Measure Greenhouse Gas Emissions From Transportation
With transportation producing the lion’s share of carbon emissions, measuring greenhouse gases is a crucial step in fighting climate change, improving air quality, and protecting vulnerable communities. Here’s what you need to know to start measuring emissions now and power effective decarbonization initiatives.

Jump Ahead
Decarbonization is a hot topic (pun intended) in the transportation industry. As the impacts of climate change become increasingly evident, federal funding has also materialized for climate-friendly infrastructure projects. In the U.S., the Bipartisan Infrastructure Law (BIL) set aside grant funds for projects that help reduce emissions, increase sustainability, and improve resilience against climate change. Meanwhile, in Canada, the Net-Zero Emissions Accountability Act enshrines a commitment to achieving net zero emissions by 2050.
After all, transportation is the top source of greenhouse gas (GHG) emissions in the U.S., representing 27% of emissions in 2020, according to the EPA.
But even with funding available, reducing carbon emissions is no small feat. It relies on a variety of specialized efforts, from speeding EV adoption and building charging infrastructure to reducing overall Vehicle Miles Traveled (VMT) and encouraging active transportation modes. But all these emissions reduction strategies rely first on precise, ongoing measurement of GHG emissions across our transportation networks.

So how can we measure these emissions more accurately and pinpoint where they’re coming from? Even more importantly, how do measurements translate into climate-positive infrastructure and policy decisions? We explore each of these questions below.
How Are Greenhouse Gas Emissions Measured?
While the EPA measures and models GHG emissions from transportation, measurement has also become more common among local jurisdictions. Many cities, counties, states, and Metropolitan Planning Organizations (MPOs) have recognized the need to go beyond blunt GHG measurement based on national averages of metrics like speed and VMT as they seek to design and prioritize projects that will truly impact climate change as well as air quality.
These public agencies, often in partnership with AECs, are increasingly focused on the granular factors like vehicle type, dwell time, and localized VMT that help pinpoint significant sources of transportation emissions and identify areas with the worst air quality.
The question for many agencies is how to measure greenhouse gas emissions precisely in order to yield actionable insights. After all, it isn’t enough to know how high total GHG emissions are in your area, you need data that guides a concrete, likely multifaceted plan toward GHG reduction.
Because gas-powered vehicles release carbon dioxide and other emissions into the atmosphere when they burn fuel, it’s obvious that the more we drive, the more emissions we create. For this reason, measuring Vehicle Miles Traveled (VMT) or Annual Average Daily Traffic (AADT) can help establish an estimate of GHG emissions in an area and pinpoint areas of high traffic where mode shift initiatives or charging infrastructure may help lower emissions.
VMT is particularly relevant when measuring GHG emissions because longer trips create more emissions. Taking the average passenger vehicle emission rate of 404 grams of carbon dioxide per mile, estimating emissions from VMT is a simple matter of multiplication.[1]
Still, these metrics alone don’t tell the full story.
For example, they may not reveal how many vehicles on the road are electric vs. gas-powered, heavy-duty trucks vs. cars, or how much time each vehicle spends stuck in traffic. All these factors can impact the amount of CO2 a vehicle emits per mile traveled. To account for these factors, Vehicle Hours of Delay (VHD), trip speed, and trip duration may also be analyzed.

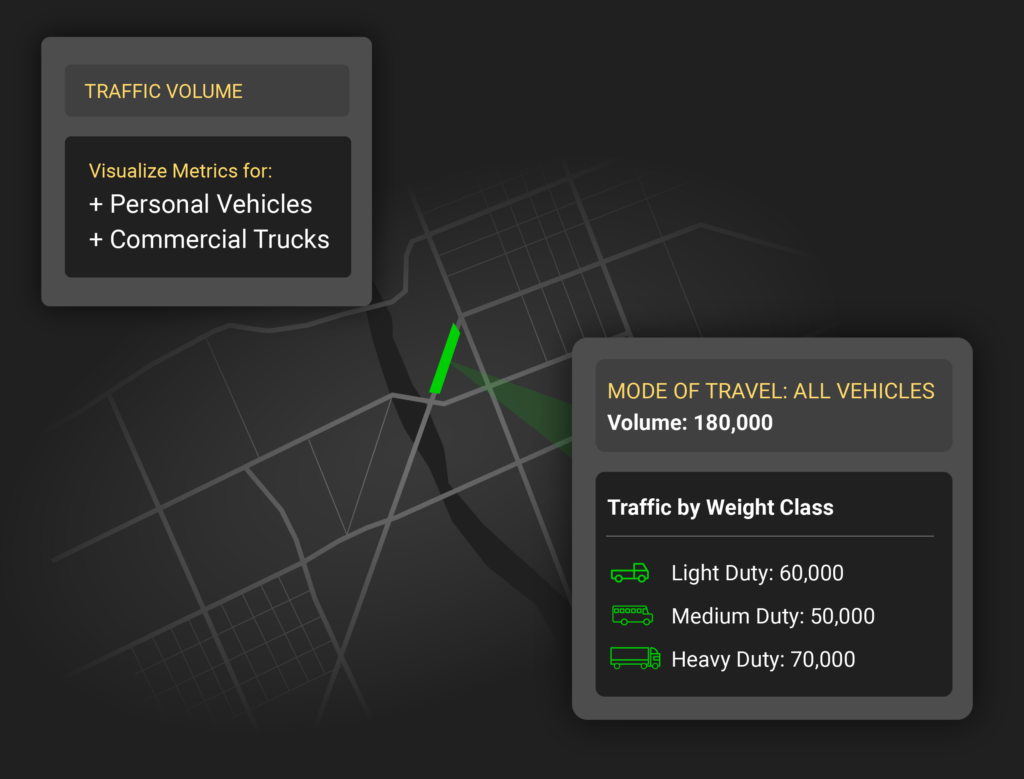
Likewise, the ability to segment traffic by vehicle type is crucial to a full-picture understanding of localized GHG emissions. Heavy-duty vehicles like commercial trucks — especially those that run on diesel — emit considerably more CO2 per mile traveled than light-duty vehicles like personal cars. The overall emissions produced by heavy-duty vehicles are also compounded by the fact that many of these vehicles are long-haul trucks, representing a large portion of total VMT due to the great distances they travel.
To put this into perspective, when the Environmental and Energy Study Institute (EESI) analyzed emissions from medium and heavy-duty vehicles in 2015, they found they represented only 5 percent of the vehicles on the road but accounted for over 20 percent of transportation emissions.[2]

In addition to segmenting traffic by vehicle weight class, a full picture view of emissions should also consider how many vehicles on the road are electric. New technologies like StreetLight’s EV Mode can also be used to identify how much of the total VMT can be attributed to all-electric vehicles, which produce no tailpipe emissions while traveling.
Origin-Destination (O-D) and Top Routes in an area may also be analyzed to help contextualize VMT measurements and guide emissions reduction strategies. For example, if O-D data reveals significant travel between locations that are just a few miles apart, this could signal a prime opportunity to add that cycling infrastructure like bike lanes in order to encourage mode shift and reduce overall VMT.
Case in Point: O-D Analysis Informs Regional Emissions Mitigation Strategies
When creating a GHG inventory for an area, considering O-D is especially important. While it’s often easier to simply count the total VMT traveled in a given area, this method does not account for pass-through trips which start and end outside of that area. This is a problem because communities that intersect major highways often appear to generate more emissions than they actually have control over.
Accounting for the origins and destinations of trips helps inform where to focus emissions reduction strategies. It also helps local communities avoid wasted investment in mitigation measures that may not actually impact the real sources of emissions as traffic passes through the area. Instead, transportation agencies can communicate with other regional stakeholders like state DOTs, MPOs, and port authorities to inform mitigation measures that actually address the source of traffic.
The Southern Maine Planning & Development Commission used StreetLight’s Origin-Destination analytics to do just that, gaining access to hyper-localized VMT insights that would have been too expensive and computationally intensive to access otherwise. They then used these insights to calculate emissions for each community in southern Maine and identify where mitigation measures would have the greatest impact.
From measurement to reduction: how to use the data you collect
Of course, measuring VMT, VHD, trip speed, and other metrics is just one step in the decarbonization process. How can transportation leaders and practitioners use these metrics to inform emissions reduction projects?
For starters, it’s helpful to pair these metrics with other datapoints to yield precise measurements of GHG emissions, especially in cases where hard numbers are needed for regulatory compliance or air quality reporting. Other datapoints might include temperature and humidity, vehicle population (how many vehicles are in a given area), and vehicle age distribution (since older vehicles produce more emissions than newer ones).
A useful tool for accessing and interpreting these additional data sources is the EPA MOVES model. Their latest MOVES model, MOVES3, incorporates the latest data on vehicle populations, travel activity, and emission rates as well as updated fuel supply information at the county level. It also accounts for the increased emissions rate that occurs during “cold starts” (when a vehicle engine starts after a long period of disuse such as overnight) and long-haul truck trips.[3]
While the MOVES model helps account for additional factors, it’s worth noting that much of the data that goes into the model (such as average speed and VMT distribution) is taken from national averages and do not account for regional variation. That’s why we recommend pairing localized telematics data with models like these to get the full picture.
Once data has been gathered, effective emissions reduction projects usually address specific roadways where total VMT and congestion metrics like VHD are high. To reduce VMT and VHD, transportation professionals may prioritize improvements to the public transit system, add bike lanes, or address barriers to pedestrian safety such as a lack of sidewalk access or signalized crossings. Likewise, high-traffic roadways and top origins or destinations in a region may be identified as prime locations for charging infrastructure in order to speed EV adoption.
Because the most effective decarbonization strategies are multifaceted, communication with other local agencies, utilities providers, policymakers, and the public is key.
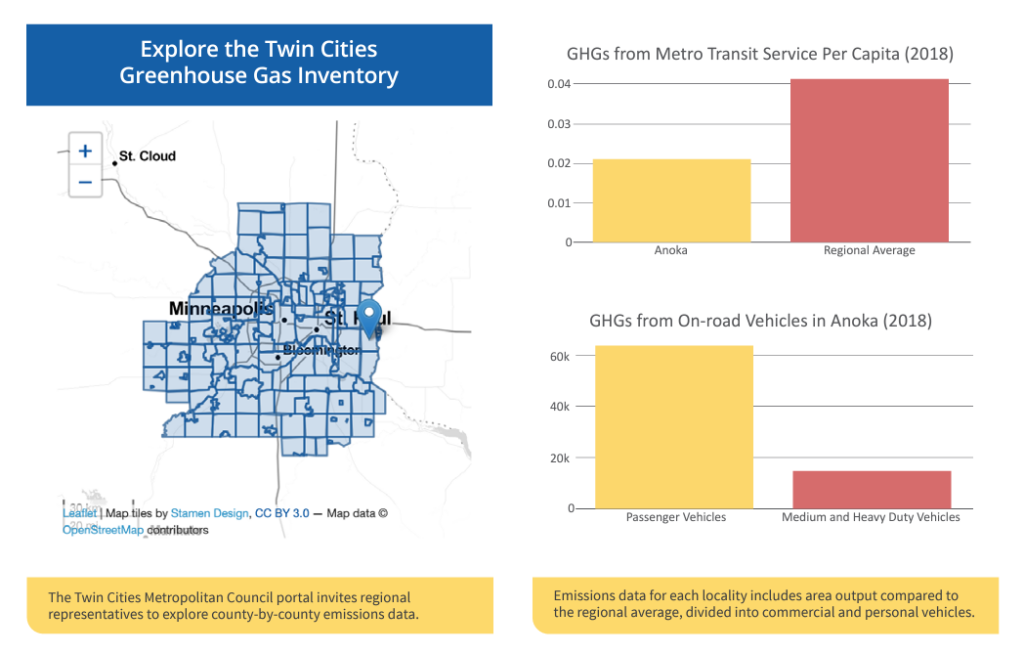
For example, the Twin Cities Metropolitan Council used StreetLight data to develop an online tool to share emissions data with local governments. This way, individual jurisdictions and townships could easily access publicly available data on local emissions rather than relying on national averages alone. Along the way, they used O-D analyses to solve over-counted emissions for small communities that intersected major highways, helping to clarify where emissions reduction projects would be most impactful.

For more information on turning GHG measurements into effective decarbonization strategies, download our Transportation Climate Data Guide.
- United States Environmental Protection Agency. “Greenhouse Gas Emissions from a Typical Passenger Vehicle.” June 30, 2022.
- Environmental and Energy Study Institute. “Fact Sheet | Vehicle Efficiency and Emissions Standards.” August 26, 2015.
- United States Environmental Protection Agency. “Latest Version of MOtor Vehicle Emission Simulator (MOVES).” December 9, 2022.
Ready to dive deeper and join the conversation?
Explore the resources listed above and don’t hesitate to reach out if you have any questions. We’re committed to fostering a collaborative community of transportation professionals dedicated to building a better future for our cities and communities.