How Transportation Data Can Tell A Story Federal Grant Administrators Want To Hear

With $1.2 trillion at stake in the Bipartisan Infrastructure Law (BIL), cities and municipalities are developing applications for bridge improvements, rail expansion, safety upgrades, EV chargers, and much more.
To win federal approval, applicants need to tell a compelling story for why their project will improve the community across dimensions like congestion, environmental impact, equity, and safety.
Telling that story isn’t as simple as putting numbers in bullets.
Applicants need:
- validated and current data to determine baseline assumptions and cost savings
- visualizations that can quickly and directly show impact
- demographic data to understand who will benefit
Whether you want to build new bike lanes, revamp a truck route, or create an EV charging corridor, embedding these three elements in a grant application gives you a better shot at getting a grant administrator to yes.
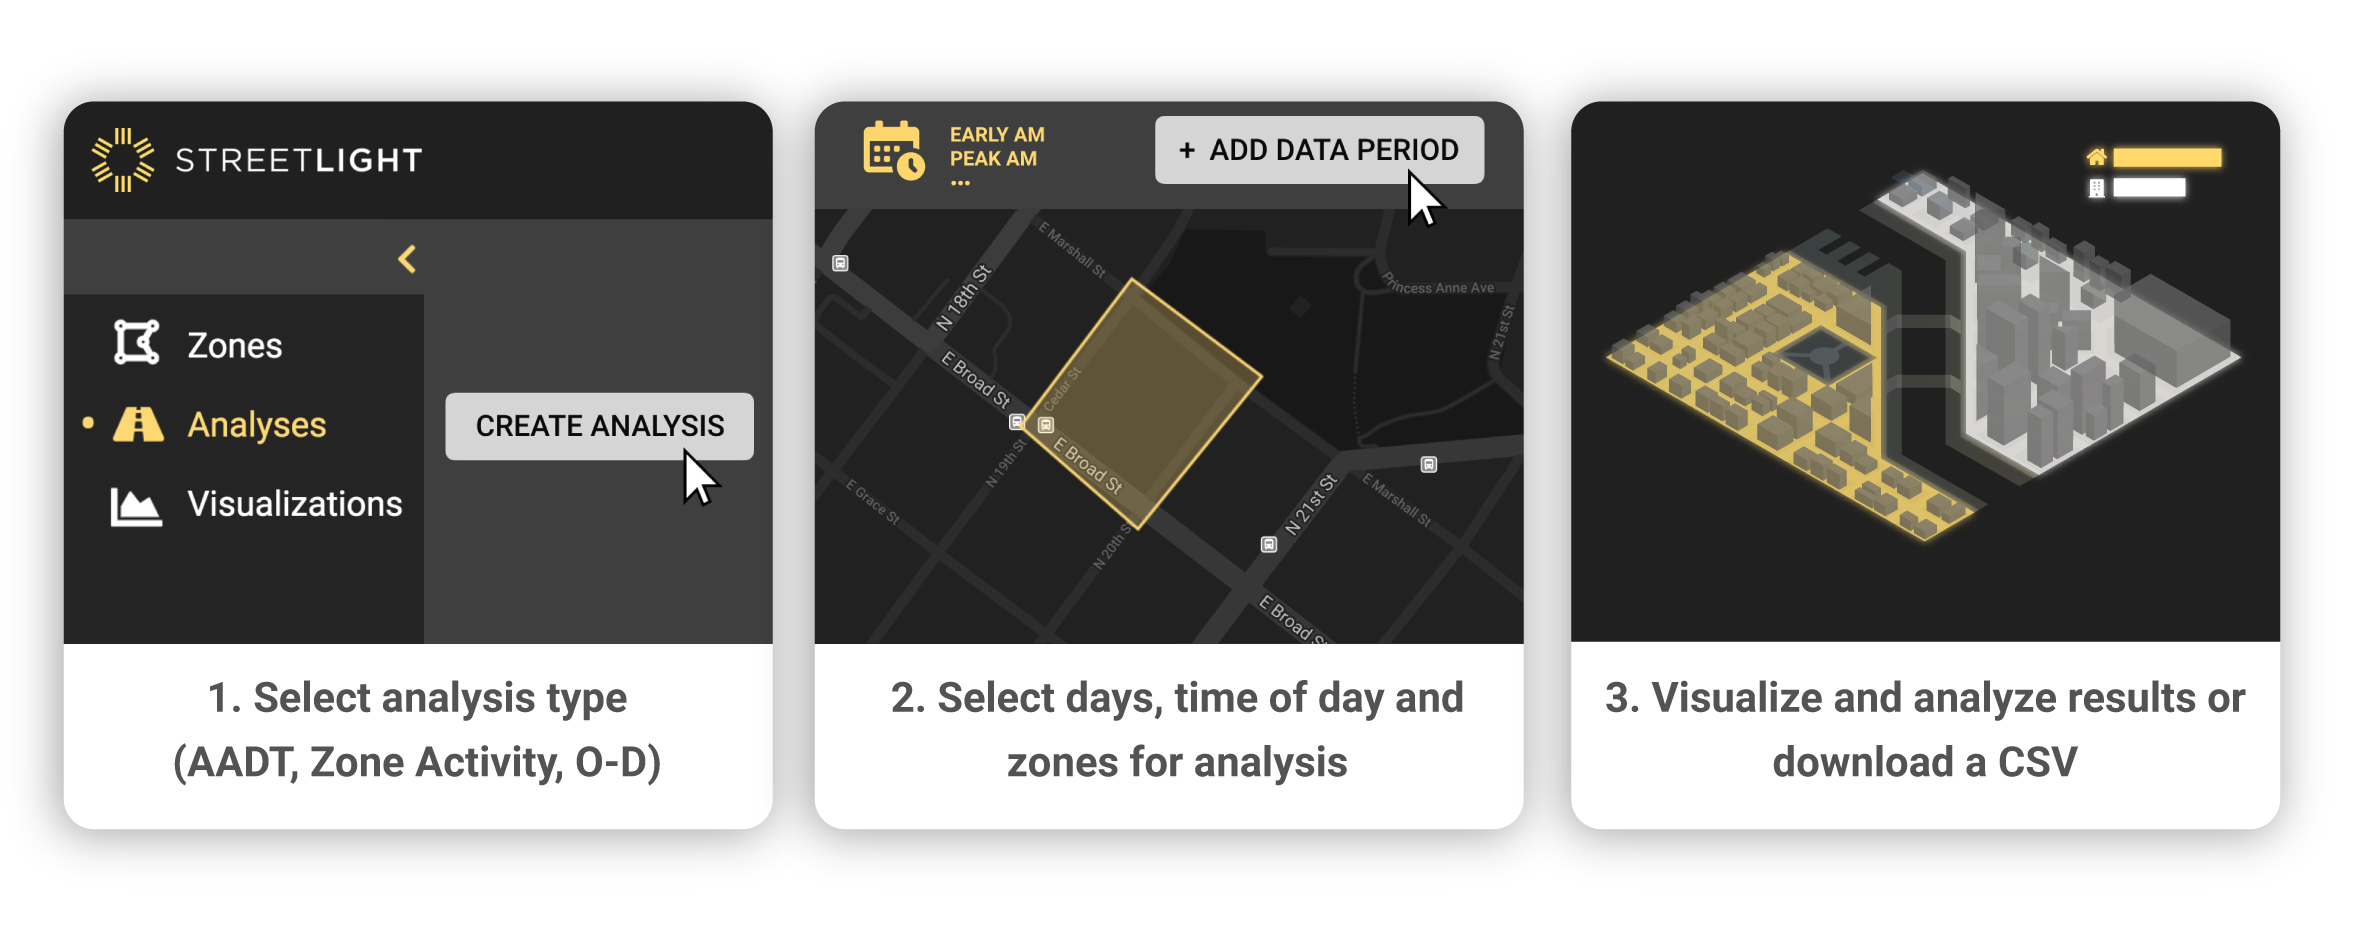
StreetLight InSight® lets you visualize your results on the flyGrant applicants have used StreetLight for everything from highlighting commuting metrics to show a project’s economic value to using bike and pedestrian metrics to give the full mobility picture to origin-destination analysis to show regional benefit.
In Ohio, for example, the state DOT embarked on a project to revamp Interstates 70 and 71, which would improve corridors of the National Primary Highway Freight System and help reconnect communities adversely affected by redlining and the construction of those interstates.
To fund Phase 4 of the development, Ohio DOT applied for a federal Infrastructure for Rebuilding America (INFRA) grant and used StreetLight to make their case.
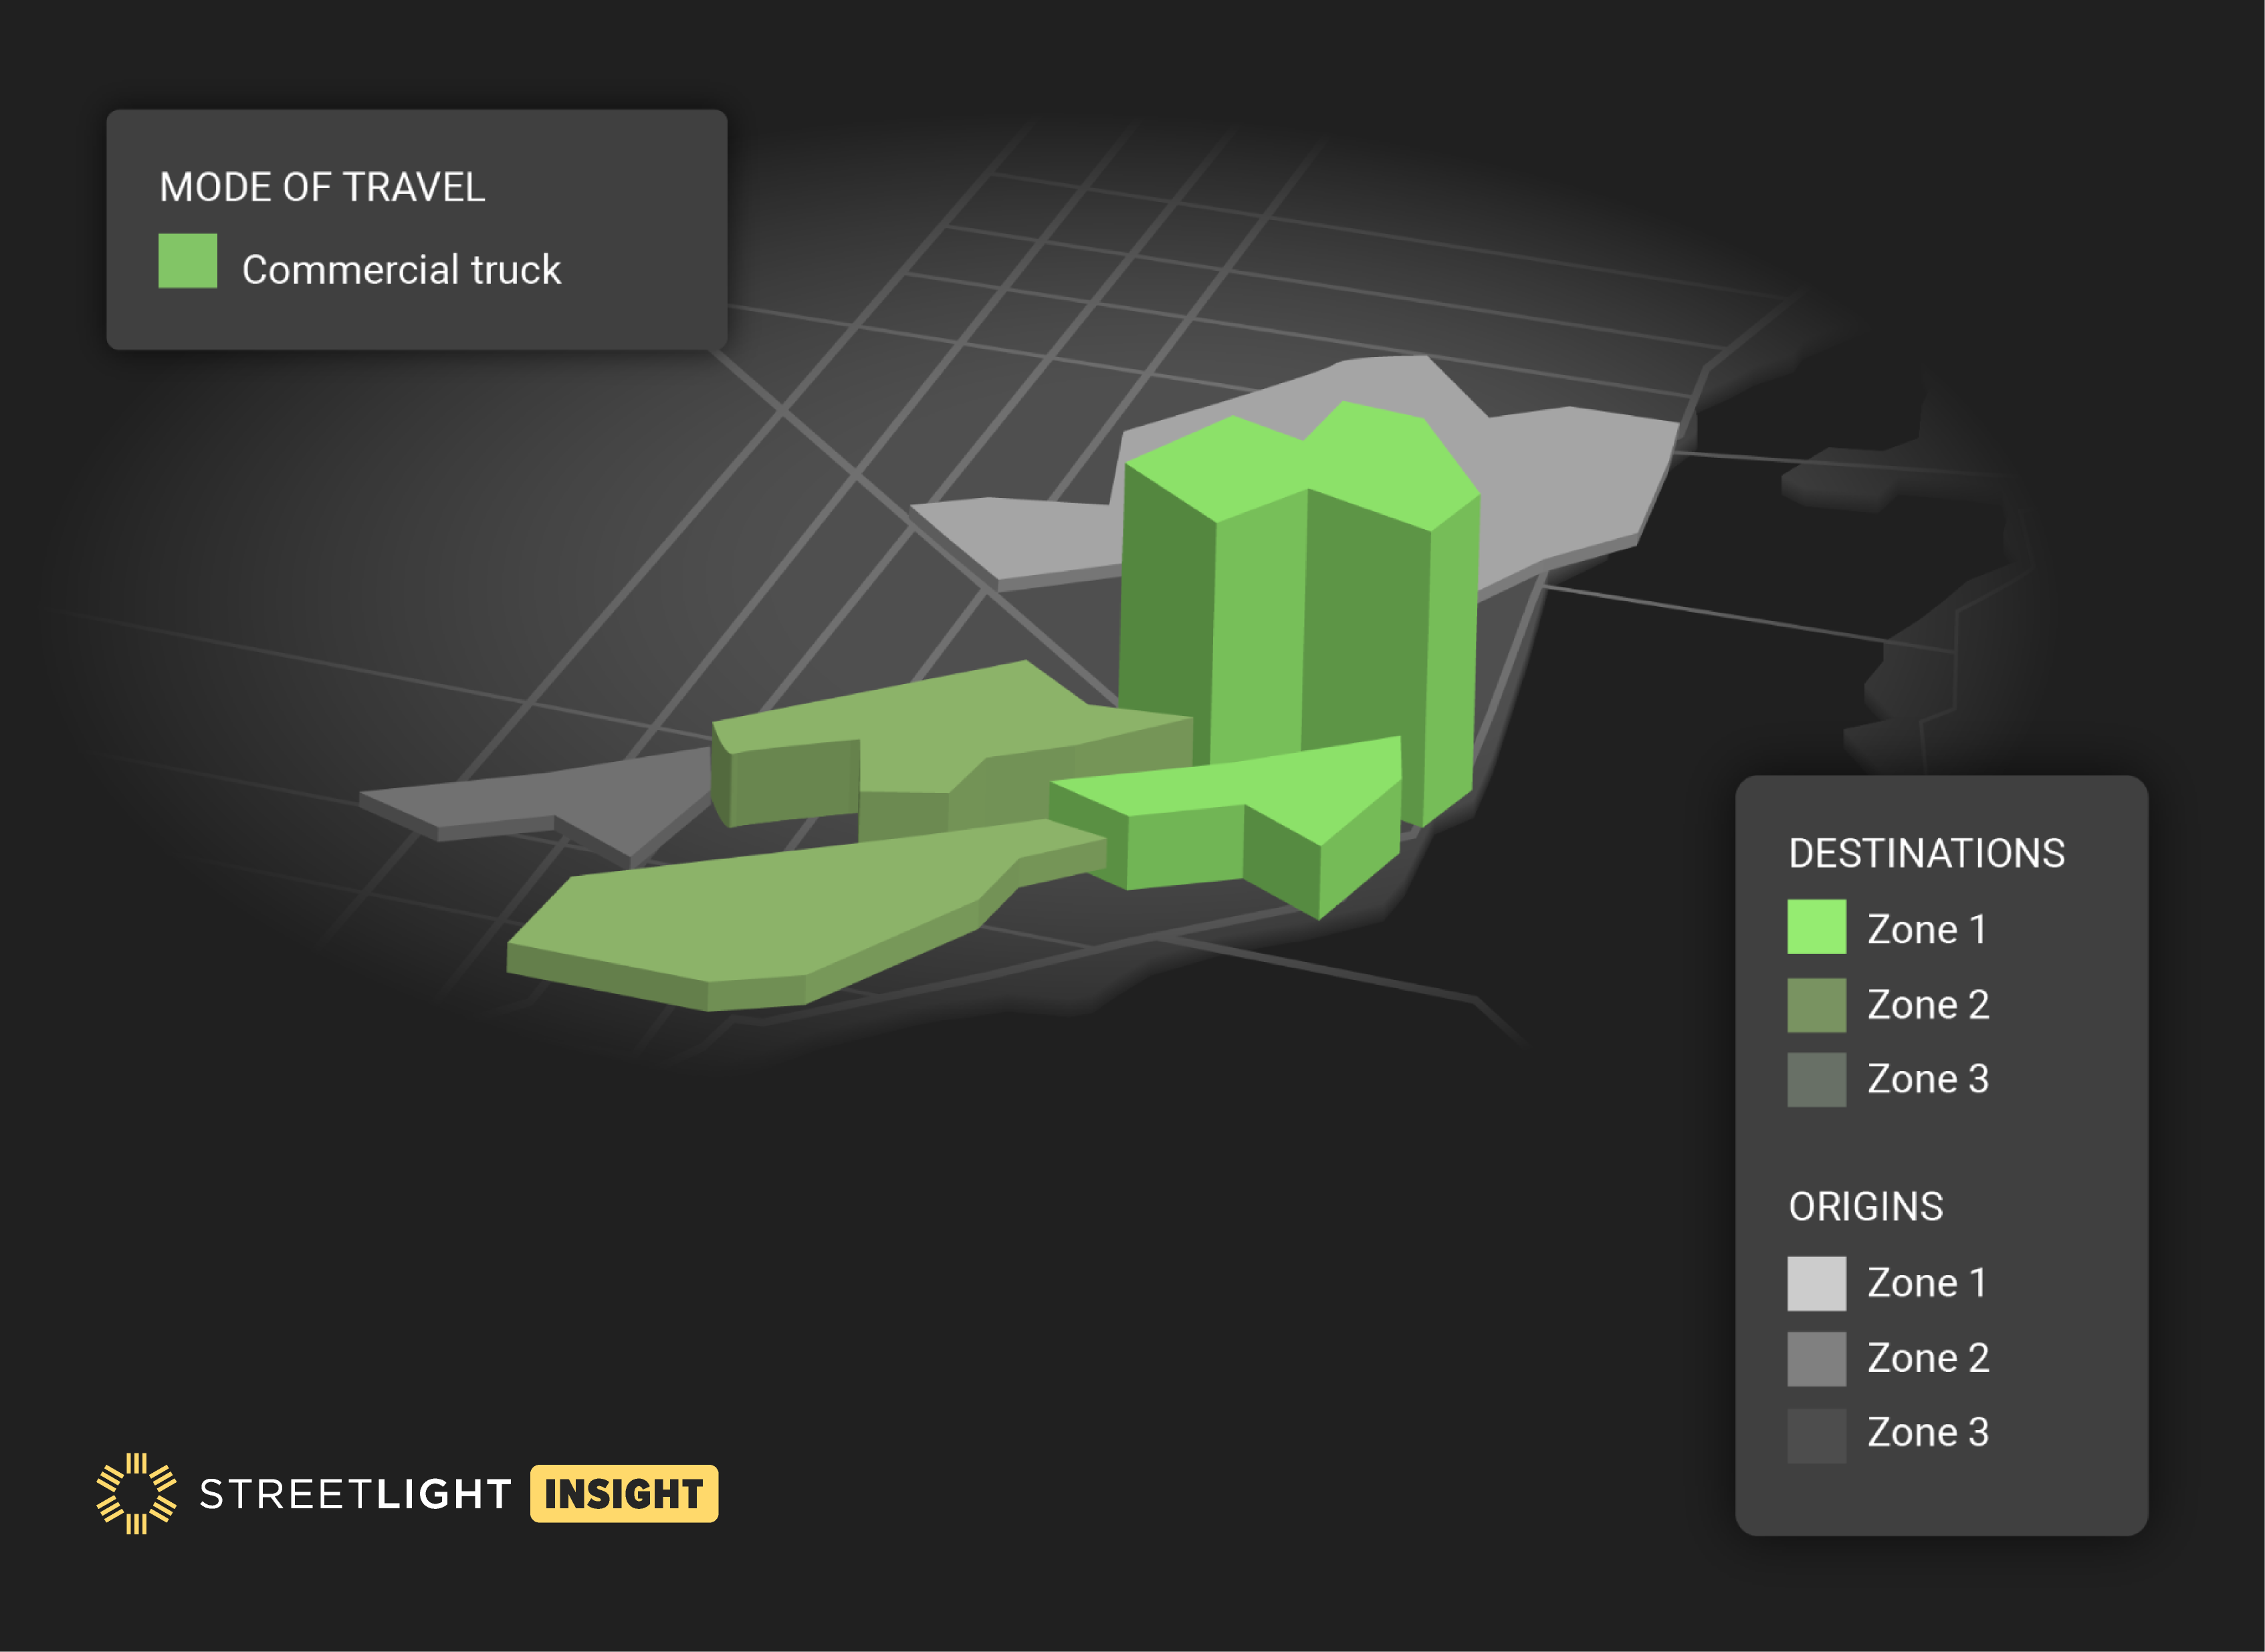
Using the platform, planners separated out passenger vehicles from commercial truck volume, proving the significant percentage of traffic on the corridor from freight movement. They used StreetLight’s visualization tools to show truck congestion in the existing corridor and make the case for how a new truck route would ease the national supply chain.
StreetLight InSight® Origins and Destinations for commercial trucks. 3D visualization with bar height depicting traffic volume of major origin and destination zones. StreetLight also allowed planners to establish baseline data that grant reviewers could validate to make sure the assumptions underlying the proposal were legitimate, and metrics available within the platform allowed the DOT to establish travel time savings from the revamp and project cost savings.
The proposal showed a clear positive impact on the national supply chain using easy-to-digest visuals and reliable metrics.
The result: federal authorities not only approved the grant but did not require any further petitioning.
For a step-by-step guide to winning transportation grants, download our e-book and take a deeper look at the tools and techniques that can get federal grant administrators to yes.
Drive Your Bid for Infrastructure Dollars
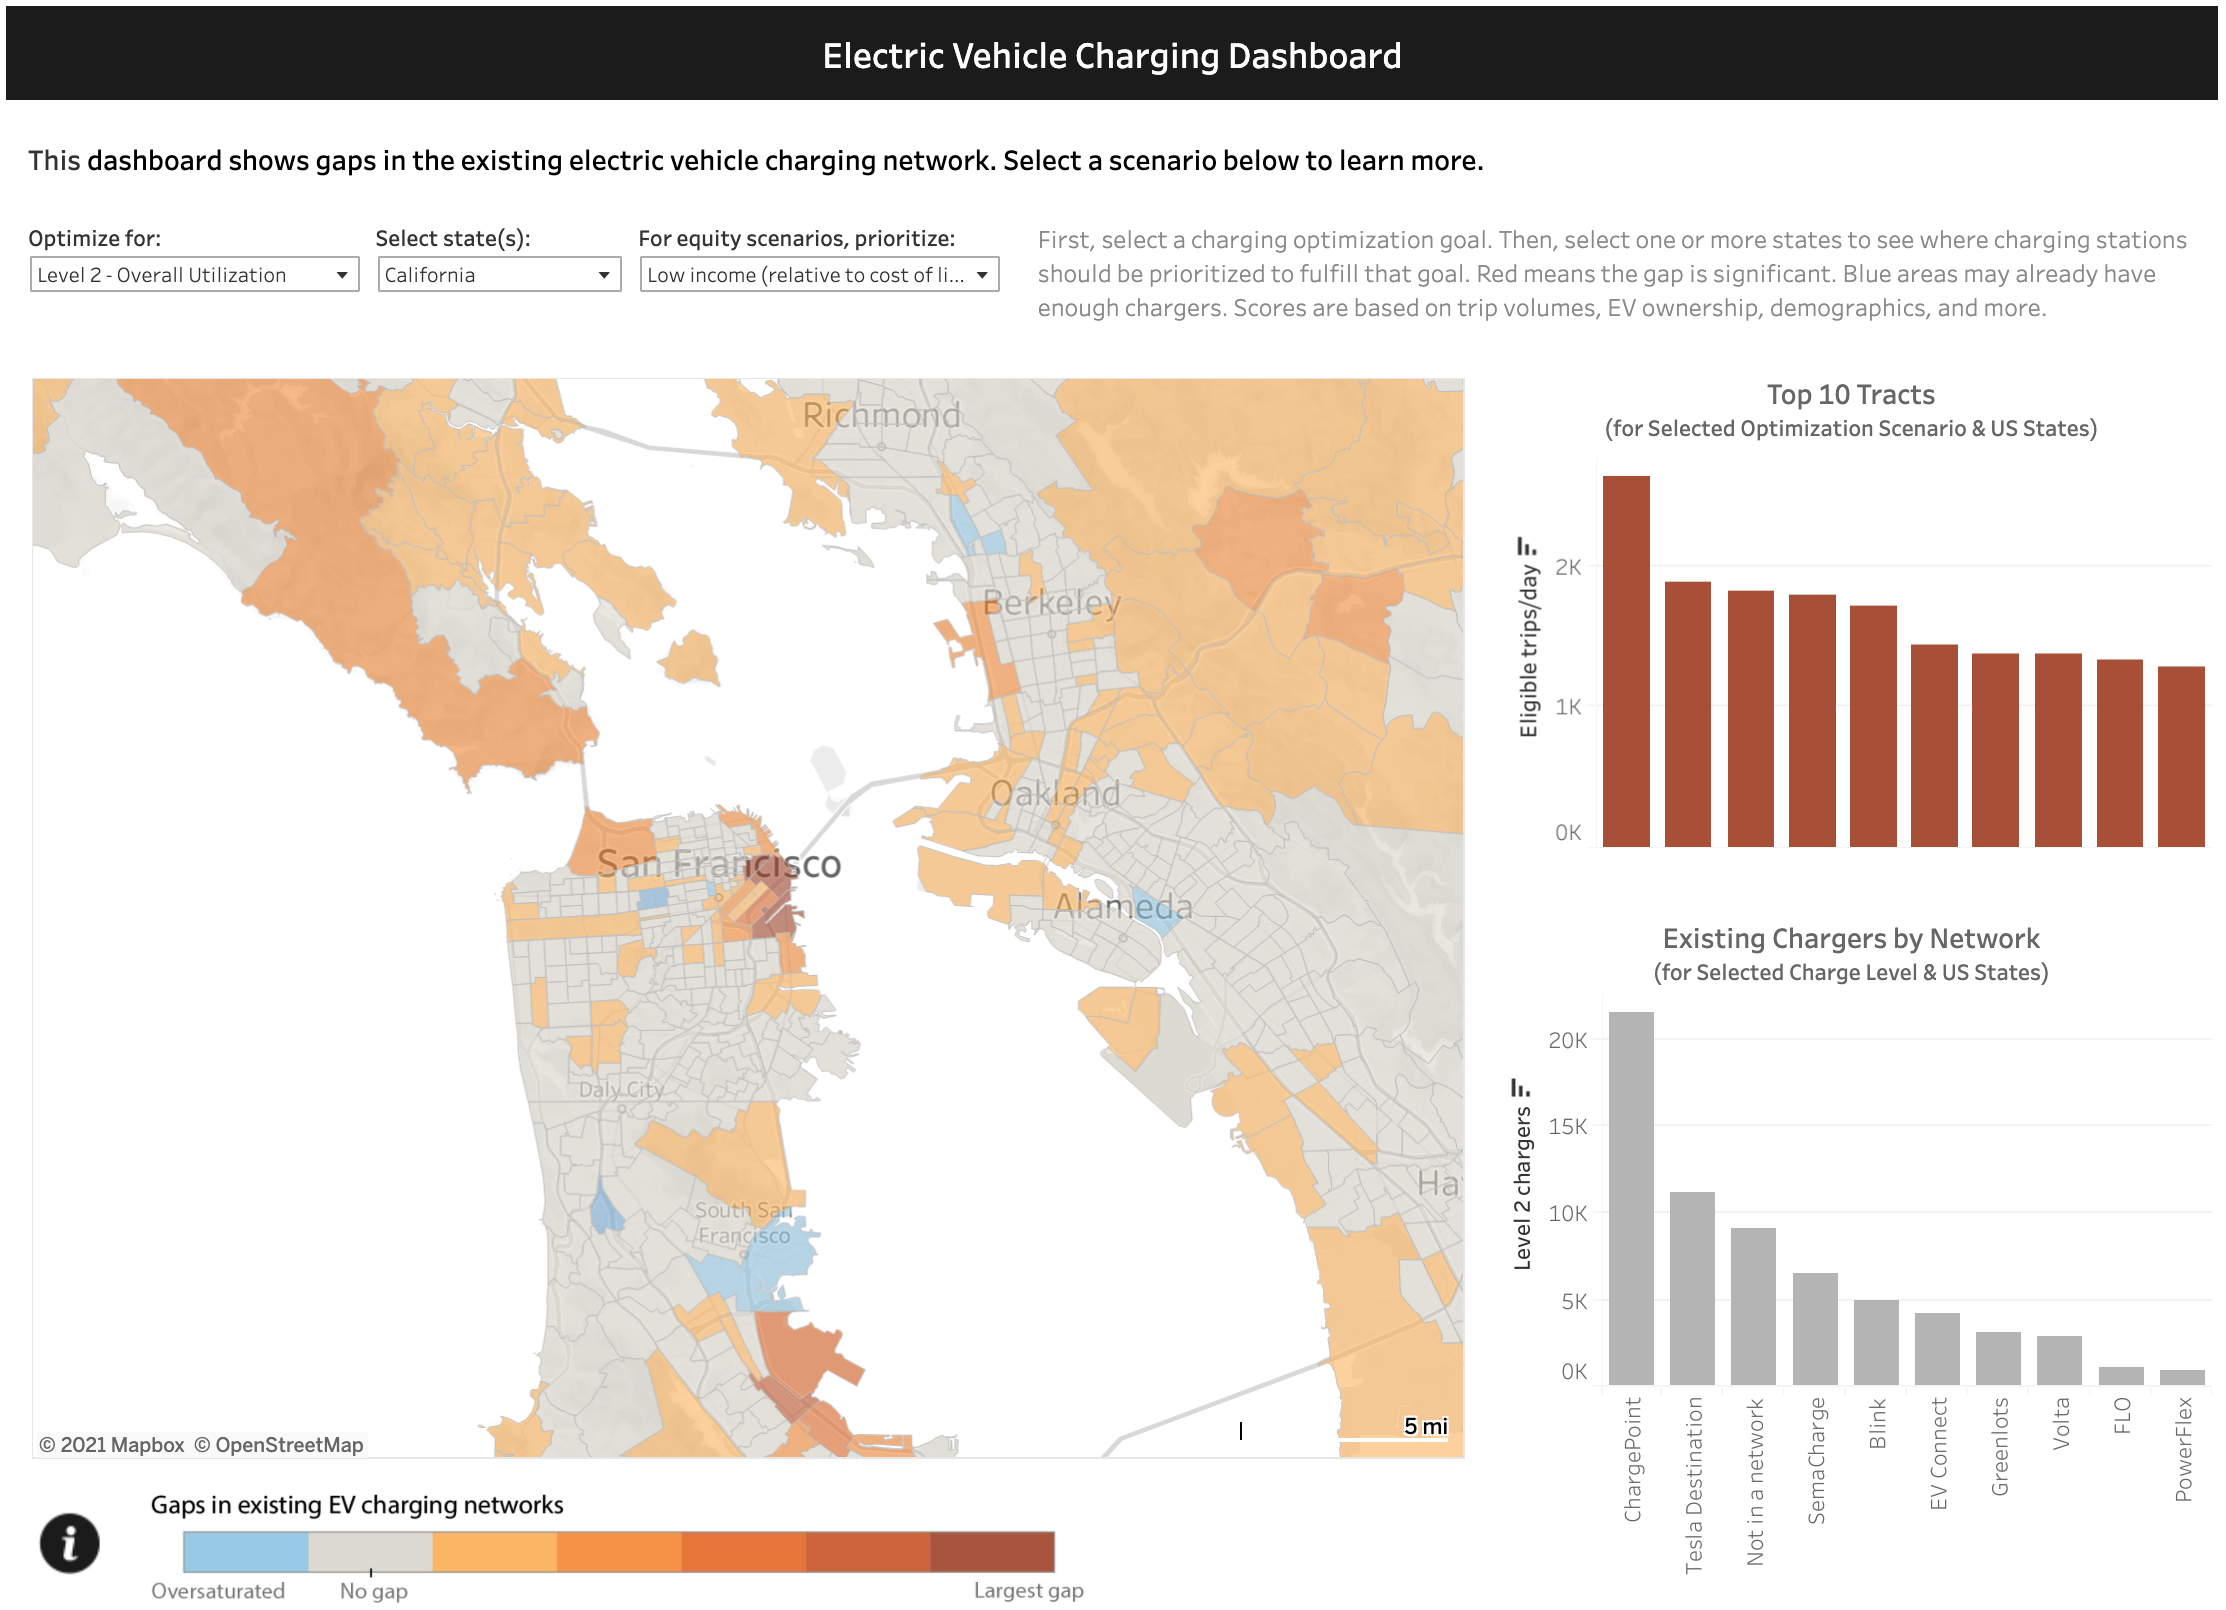
There are a limited number of dollars, and the stakes are high. Mobility metrics and demographic data can support your proposal for NEVI Program funds. StreetLight’s EV offerings will help you identify optimal charging sites along key corridors to serve your key priorities, grow EV adoption, and help shape our EV future as a nation.


