The Data Behind How Speed Cameras Curbed Crash Rates on One of Philadelphia’s Most Dangerous Roads
The Data Behind How Speed Cameras Curbed Crash Rates on One of Philadelphia’s Most Dangerous Roads
To fix deadly speeding on one of America’s most dangerous roads, Philadelphia installed speed cameras along eight sections of Roosevelt Blvd. Now, before-and-after analysis by StreetLight reveals how effective the strategy really was, and whether it could save lives in other cities.

Roosevelt Boulevard (US Route 1) in Philadelphia, PA has been dubbed one of America’s most dangerous roads. This twelve-lane highway is host to both local and commuter traffic, with at-grade express and local lanes traveling along its length.
Dozens of crashes resulting in severe injury or death occurred on the boulevard in 2020 alone, many of them involving pedestrians. [1] And because Northeast Philadelphia is home to a number of densely populated disadvantaged communities, the victims this boulevard claims are disproportionately people of color, whose communities have long been bisected by these twelve lanes of fast-moving vehicles.
In 2020, the city took measures to address the boulevard’s high crash rates, installing speed cameras along eight sections of Roosevelt Blvd. To understand how these cameras impacted safety conditions on the corridor, StreetLight used its transportation data platform to analyze vehicle speeds before and after the camera installation, looking at data from before COVID, during the pandemic, and as recently as 2024.
Then we investigated where high vehicle speeds persist on the boulevard, revealing potential locations for the next set of traffic calming interventions.
In this article, we’ll explore:
- Roosevelt Boulevard’s speed problem
- What Philadelphia is doing to reduce speeding
- Whether speed cameras made Roosevelt Blvd safer (and how much)
- How cities can choose the right traffic calming measures and evaluate their impact
Roosevelt Boulevard’s Speed Problem
At the heart of Roosevelt Blvd’s high crash rates is a history of dangerous vehicle speeds. Although the posted speed limit for much of the highway is 45 miles per hour, residents have complained that drivers on Roosevelt Blvd routinely exceed this limit. In one extreme case in 2013, four pedestrians, including three children, were struck and killed by two motorists traveling over 40mph above the posted speed limit. [2]
Data from PennDOT corroborates residents’ testimony, indicating that prior to 2020, 55% of crashes on the boulevard were attributed to speeding and aggressive driving.
A number of factors make the boulevard’s speed problem particularly deadly. Surrounding the 12-lane freeway, a growing population of Northeast Philadelphians generate significant pedestrian traffic as they access goods and services from the businesses that call Roosevelt Blvd home. Because many of these residents are from Disadvantaged Communities (DAC), they are also less likely to have access to a car, making them reliant on more vulnerable modes of transportation like walking and biking.
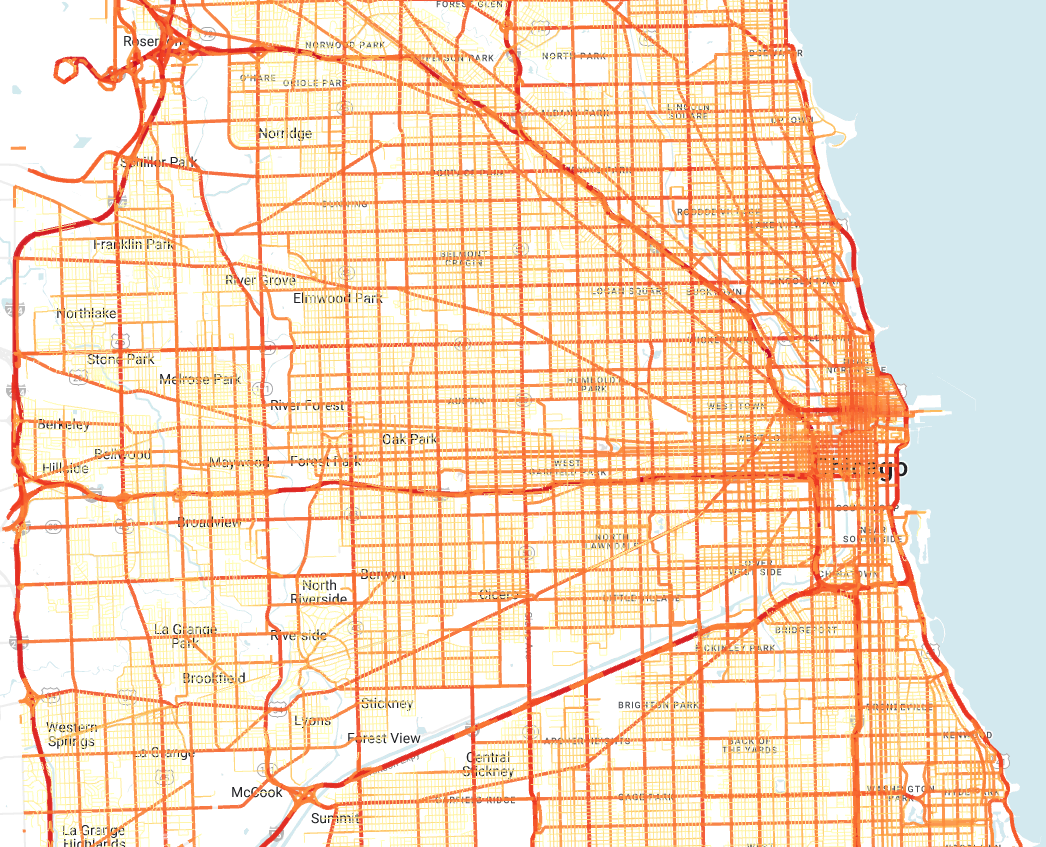
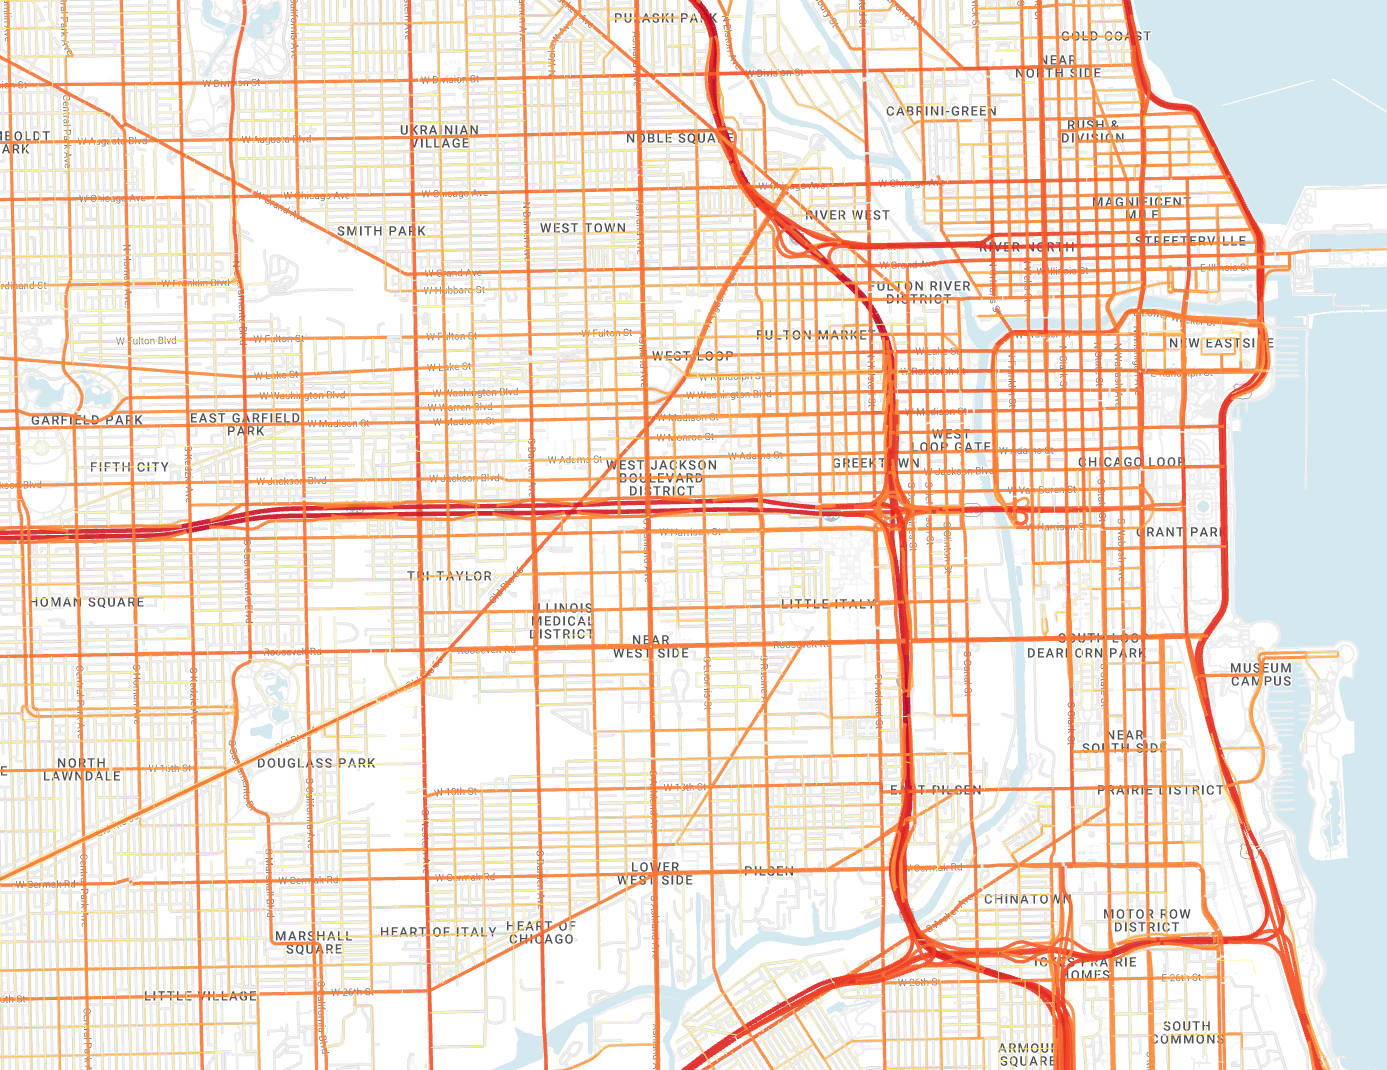
In the image below, StreetLight’s Justice 40 map layer highlights in purple the many Disadvantaged Community census tracts that surround Roosevelt Blvd.

Meanwhile, the roadway design has limited infrastructure designed to improve pedestrian safety or slow vehicles, such as pedestrian islands, bulb-outs, or signalized crossings, dramatically increasing the risk pedestrians face on the stroad.
Considering that pedestrians are five times more likely to die from crashes when cars are traveling 40 mph vs. 20 mph, according to data from the AAA Foundation, any vehicle exceeding the boulevards’ posted speed limit of 45 is likely to kill any pedestrian it strikes. [3]
Philadelphia’s Plan to Reduce Speeding
Now for the good news: a number of safety improvement projects are already in the works to address high crash rates on Roosevelt Blvd.
The City of Philadelphia has secured $10 million in state grants from PennDOT to be used on curb extensions, realignments to crosswalks, traffic lanes, and turning lanes, upgraded traffic signals, and other projects. Another $2 million will go toward the planning of future road design improvements as part of the city’s Route for Change program. [4]
While some of these improvements will be completed as far out as 2040, speed cameras offered the city a faster way to curb dangerous vehicle speeds in the short term.
In 2020, the City of Philadelphia, along with the Philadelphia Parking Authority, installed speed cameras along eight particularly dangerous stretches of Roosevelt Blvd to automate speed enforcement and ticket offenders.
Did Speed Cameras Make Roosevelt Blvd Safer?
Initial reports from the city have shown positive impacts from the speed cameras, with a 90% reduction in excessive speeding, a 36% drop in car crashes, and 50% fewer traffic deaths in the first seven months. [5]
How did speed cameras achieve such a dramatic effect, and will they continue to positively impact crash rates on the boulevard beyond their initial install? Furthermore, will the tactic be as effective in other cities, or along other roadways in Philadelphia’s high-injury network? Finally, are additional safety improvements needed to achieve the city’s Vision Zero goals for the boulevard?
To investigate these questions, we used StreetLight’s Network Performance tool to look back in time at speed conditions before cameras were installed, track the changes in average speeds (as well as rates of speeding) after cameras were installed, and follow up on where speeds are at now, in 2024, to identify where additional safety improvements may still be critical.
Establishing a Baseline
To understand how speed cameras impacted speeds on Roosevelt Blvd, we need to look back at speed conditions prior to their installation in June 2020. Because StreetLight’s Network Performance tool offers five years of comparable data, we can go all the way back in time to March 2019 to establish our baseline.
This timeframe is particularly useful as a baseline, because it allows us to look at typical speed conditions before the COVID pandemic disrupted traffic patterns across the country (we’ll look at how COVID impacted speeds in the next section).
To establish our baseline, we’ve chosen to analyze a typical Tuesday during the peak morning commute hours (8-9 a.m.). (Notably, this section of Roosevelt Blvd is relatively uncongested so even during peak hours, speeds are not tamped down significantly due to traffic.)

In the map above, we can already see that average speeds exceed the 45 mph speed limit along many segments of the boulevard, and we can see where speeding is at its worst, with segments near Pennypack Park, Northeast Philadelphia Airport, and the Woodhaven Rd (PA-63) interchange standing out.

In the image above, we zoom in on a segment of Roosevelt where multiple fatal crashes have occurred — the Southbound express lane over Pennypack Creek. Looking at speed distribution by hour of day reveals that at 8 a.m. on an average Tuesday, the mean speed on this segment is 51 mph. Meanwhile, the 85th percentile speed (i.e. the speed that 85% of vehicles on the corridor are travelling at or below), which is commonly used to estimate rates of speeding, is 59 mph.
Bearing in mind that the posted speed limit is 45 mph along most of the boulevard, these figures reveal that speeding was indeed a significant issue in 2019. And that was before the COVID road safety crisis.
See how dangerous traffic speeds impact walking and biking in your region
Download Safe Speed IndexHow COVID Worsened Speeding
It has now been well established that as roads emptied out during the March 2020 stay-at-home orders and subsequent rise in remote work and social distancing, vehicle speeds increased. Unsurprisingly, deadly crashes also spiked. This phenomenon is likely due to the relationship between road capacity and vehicle speed — as capacity increases, drivers tend to take advantage of the extra space to speed up. (This is also why road diets, with their reduction of lane capacity, are considered an effective safety intervention.)
Roosevelt Boulevard was no exception. Looking at the same deadly segment of roadway above Pennypack Creek, we can see that rates of speeding increased above their already high levels.

During the peak a.m. hours, average speeds remain the same compared to 2019 (51 mph), but the 85th percentile speed has increased slightly to 60 mph. We also observe that speeds tend to spike even higher during non-peak hours, especially during the late evening.
To address this crisis, just a few months later, in June 2020, the City of Philadelphia installed speed cameras along eight particularly deadly stretches of Roosevelt.
Slowing Down: How Cameras Curbed Dangerous Speeding
Looking at average and 85th percentile speeds along Roosevelt Blvd in March 2022, our analysis corroborates the city’s initial reports of reduced speeding.

After over a year of automated speed enforcement from the new cameras, average and 85th percentile speeds on the Southbound express lane over Pennypack Creek dropped significantly. The mean speed of 46 mph nearly matches the 45 mph posted speed limit. Meanwhile, the 85th percentile speed has been reduced to 52 mph – just 1 mph higher than the mean speed two years prior.
Following Up: Did Reduced Speeds Stick?
A look at recent data from March 2024 can help confirm whether the speed reduction observed in 2022 has continued, and where further safety interventions may still be critical to saving lives.

In the graph above, we chart speed distributions from each year analyzed (except 2019, which was identical to 2020 above the 30th percentile). The leftward shift highlights that overall speed continued to drop between 2022 and 2024. As of March 2024, a much larger percentage of vehicles are now traveling at or below the posted speed limit of 45 mph.
So has the boulevard’s speed problem been fixed? While rates of dangerous speeding have significantly dropped — and fatal crash rates along with them, according to city reports — some segments of the corridor may still need further intervention.

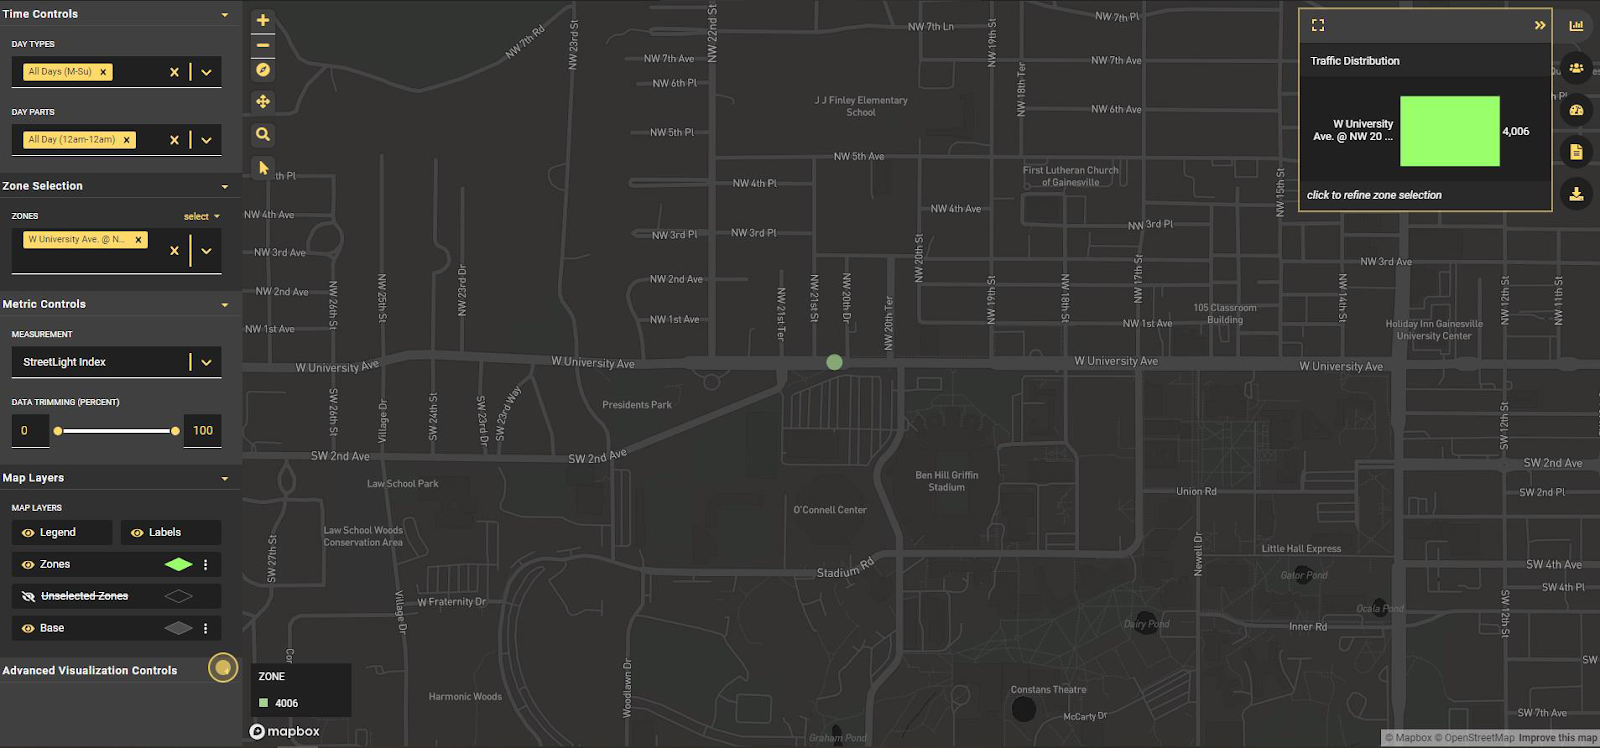
Using the data trimming tool in StreetLight’s Network Performance product, we can zero in on sections of the boulevard where high-speed traffic still poses significant risk to pedestrians. The map above highlights in red the segments with average vehicle speeds above 40 mph during peak morning hours on an average Tuesday.
Although some of these segments have average vehicle speeds that fall below the 45 mph speed limit, we chose to highlight all segments with average speeds above 40 mph because these speeds fall within the range that is particularly deadly for pedestrians, according to the AAA Foundation.
At least nine highway segments of varying lengths emerge as potential candidates for further safety intervention. As we observed in 2019, segments near Pennypack Park, Northeast Philadelphia Airport, and the Woodhaven Rd (PA-63) interchange are among these high-speed areas.
Insights like these could help city officials determine where to prioritize state grant funds slated for additional traffic calming measures along the boulevard.
Spot Speeds on Roosevelt Boulevard
While the bulk of this analysis examines segment speeds, which are derived from a vehicle’s travel time from one end of a roadway segment to another (and the distance between those points), it can also be useful to examine spot speeds at specific locations along a corridor when evaluating potential safety improvements and the success of past projects.
Spot speeds measure a vehicle’s speed at a specific point in time and space, rather than the average speed across a given segment. This means spot speeds are particularly useful when analyzing safety or congestion on smaller roadway segments, such as a single intersection. In our case, they can also help shed light on exactly where drivers slow down and speed up, revealing whether and how quickly drivers speed back up after they’ve passed a speed camera.
In the data viz below, 15 spot speeds taken on a typical Tuesday between 8 and 9 a.m. in March 2024 show vehicles slow down after passing Pennypack Creek as they approach a speed camera located near Strahle Street. Drivers then speed up again as they approach Solly Ave, slowing once more as they approach an intersection with pedestrian crosswalks at Rhawn Street. These granular insights can help cities like Philadelphia determine the most effective safety measures to further the benefits of speed cameras.

More About StreetLight’s Network Performance Tool
StreetLight’s Network Performance tool is ideal for before-and-after analyses like this. It offers five years of data comparability so cities can look back in time to understand how roadway conditions have changed over time, including traffic patterns from before COVID, which are often sought out as a baseline to understand “typical” past conditions. They can also analyze the impact of policy interventions to show the public the efficacy of their work.
Since many roadways lack permanent traffic counters (or only recently had counters installed), this ability to access historical traffic data for any road unlocks before-and-after analyses that would otherwise be impossible.
As we’ve demonstrated in our analysis above, agencies can use this Network Performance tool to proactively identify locations with a trend of excessive speeding, particularly where it overlaps with high crash rates, pedestrian/bicycle activity, or Justice40 communities.
With the data trimming option shown in the section above, agencies can easily pinpoint problematic road segments instead of relying on anecdotal observations about excessive speeding, or worse, waiting for the next crash to identify an unsafe traffic pattern. Likewise, this tool offers agencies the ability to monitor the impacts of changes in land use (e.g., new development), infrastructure (e.g. lane additions), traveler behaviors (e.g. work-from-home patterns due to COVID), traffic calming measures (e.g. speed limit reductions or speed cameras), and more.
The ability to analyze both segments speeds and spot speeds also offers added granularity that can be useful in understanding driver behaviors and diagnosing dangerous locations along a roadway.
To learn more about StreetLight’s Network Performance tool, check out our white paper: Network Performance Analysis Methodology and Validation.
And for more ways to implement data-driven safety improvements in your city, download our free eBook: Practitioner’s Guide to Solving Transportation Safety.
- Delaware Valley Regional Planning Commission. Crash Statistics for the DVRPC Region. https://www.dvrpc.org/webmaps/crash-data/
- CBS News. “Philadelphia’s Roosevelt Blvd. Among most dangerous roads in US” July 10, 2023. https://www.cbsnews.com/philadelphia/video/philadelphias-roosevelt-blvd-among-most-dangerous-roads-in-us/
- AAA Foundation for Traffic Safety. “Impact Speed and a Pedestrian’s Risk of Severe Injury or Death.” September 2011.
- Michaela Althouse. Philly Voice. “Philadelphia gets $19.3 million for road safety projects from PennDOT, most directed to Roosevelt Boulevard work.” February 3, 2024. https://www.phillyvoice.com/roosevelt-boulevard-traffic-safety-projects-philadelphia-grants-penndot/
- Philadelphia Parking Authority. Roosevelt Boulevard Automated Speed Camera Annual Report. April 2023. https://philapark.org/wp-content/uploads/2023-Speed-Camera-Report-Final-32023.pdf

Investigate local traffic trends with a free trial of StreetLight InSight®
Request your Free TrialReady to dive deeper and join the conversation?
Explore the resources listed above and don’t hesitate to reach out if you have any questions. We’re committed to fostering a collaborative community of transportation professionals dedicated to building a better future for our cities and communities.