Getting Transportation and Land Use to Work Together

Getting Transportation and Land Use to Work Together
Like most transportation engineering professionals, my graduate school studies were filled with learning about optimizing traffic flow: In other words, how can we move the most vehicles as fast as possible? We were even given equations to understand how to maximize volume and speed.
Fast forward a few years and I am living in the heart of Atlanta, Georgia, a city that has worked hard to maximize volume and speed on its roadways. One day, while walking through traffic to my neighborhood grocery store, I started thinking back to my graduate school days. Even though I could have driven to the store quickly on the Atlanta roads, I preferred to walk. I realized that good planning involves a lot more than just vehicular volume and speed. Transportation is sometimes more complex than I was taught.
Aligning Transportation and Land-Use Goals
On that street in Atlanta, I realized that transportation problems sometimes require additional context to fully understand and solve them. For example, those equations I learned in graduate school didn’t teach us that a person is more likely to walk next to a 25 mph roadway than a 35 mph one. Or that someone living in a high walkability area will drive fewer miles in a day. Or even how to identify and quantify something like “high walkability.”
When transportation experts step back to look at the bigger picture, they need to know how transportation fits into the greater issue of land use.
From my perspective as a solutions engineer at StreetLight, part of contextualizing transportation’s larger problems comes down to data, and how it’s used. Transportation engineers and planners often work together on big projects, but use different data to analyze and understand the issues. This can create misaligned goals and objectives — for example, a transportation expert may be looking at land use from the perspective of making streets safer, when a city engineer may be studying how to make them faster.
How to Study Larger Planning Issues
Instead, how about contextualizing larger transportation goals and objectives within land-use frameworks? We could study questions like:
- How fast are people driving around school zones?
- Are people living in walkable areas traveling less to get to their destinations?
- Where is the best location to place bike infrastructure to connect residential areas with work destinations, while avoiding high level-of-stress routes?
Without easy tools to visualize both transportation and land-use data, these questions often end up with varied answers. Or they’re simply left unanswered.
Expand the Data Set for Answers
At StreetLight, we want to enable this bigger picture, and help both planners and transportation experts understand more than just the transportation piece of the mobility puzzle. We want to give land-use planners the ability to contextualize transportation metrics.
To do this we have partnered with UrbanFootprint, the leading software platform for sustainable city design and urban planning. UrbanFootprint understands the power that planning and mobility decisions have to affect a community’s overall livability, along with its fiscal, environmental, and public health.
StreetLight and UrbanFootprint have come together to ensure that planners can get the most out of combined transportation and land-use data.
Our transportation data is now helping support UrbanFootprint’s planning platform. This means planners can now analyze a project with the most valuable transportation data in the industry.
As always, StreetLight stands ready to support in-depth mobility analysis with our on-demand transportation metrics. But for larger planning issues that require contextual data, we are excited to bring mobility context to UrbanFootprint’s extensive data and planning toolset.
Is Congestion Pricing Right for Atlanta?

Is Congestion Pricing Right for Atlanta?
From Los Angeles to New York, planners are talking about congestion pricing , and Atlanta is one of the metro areas involved in the discussion. Atlanta is the 3rd fastest-growing metro area in the U.S., and 11th most congested city in the country. “All options need to be on the table to address traffic. It’s a real quality of life issue that I’m committed to solving and will use all means to do that,” Councilman J.P. Matzigheit said on the news recently.
I have a lot of personal interest in this topic because I live and work in Midtown Atlanta. Since I also happen to work for a company that uses Big Data for transportation analytics, I decided to run my own sample study on Atlanta’s congestion. I found some insight on why congestion pricing may make sense for this busy city.
Why Congestion Pricing Is a Thing
Peachtree Street is a seven-mile corridor stretching north from downtown Atlanta through the Midtown area to Buckhead. The corridor comprises 58% of jobs in the city, and five times the population growth of the city at-large.
My analysis showed that on a daily basis, a total of 120,000 vehicles move along the five roadways stretching north to south in Midtown, the kind of volume that you’d usually see on a local interstate. But how many of these vehicle owners live in the city or county and pay local taxes?
It’s important to know who contributes to congestion because my local taxes bear the burden of paying for Atlanta’s MARTA transit system (which relieves congestion during the peak travel periods). But the city’s residents aren’t the only drivers contributing to congestion, and it seems fair to spread the responsibility for congestion among those who cause it.
Both the city and county have recently voted to increase our taxes to fund more local transportation projects, but some nearby counties have rejected such taxes.
Perhaps voters don’t fully understand their role in Atlanta’s congestion. To share that information, cities must run congestion studies, and disseminate the results. It’s not as easy at it sounds. Traditionally, the information required to support a congestion study has been difficult to obtain. This includes:
- Volume of trips
- Home locations of trips
- Work locations of trips
- Demographics of travelers
- Mode of travel
- Purpose of travel
- Frequency of travel
Until now, the only way to get this information has been via household travel surveys, employer surveys, or travel-demand modeling. Often, by the time this information is collected and analyzed, it is already outdated, and covers only a small sample of the population. But our new Home and Work Locations analysis covers everything a city needs for a congestion-pricing study.
Sample Congestion Analysis Data
I ran a sample Home and Work Location analysis using our data platform, StreetLight InSight®. I chose to study Spring Street, a major commuter road in Midtown. In just a few minutes, I uncovered some interesting outcomes:
- There are 29,000 trips daily on Spring Street.
- Atlanta locals make up only 22% of trips on Spring Street during weekday rush hours, with 78% of trips are coming from outside Atlanta.
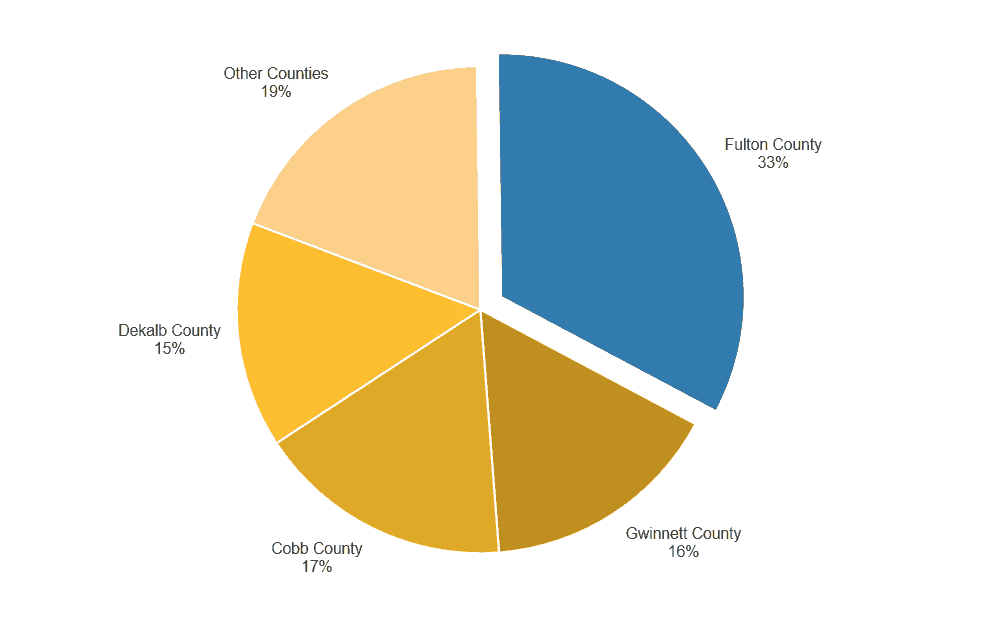
- Surprisingly, 16% of total trips are coming from Gwinnett County, a county where voters rejected paying into the MARTA transit system.
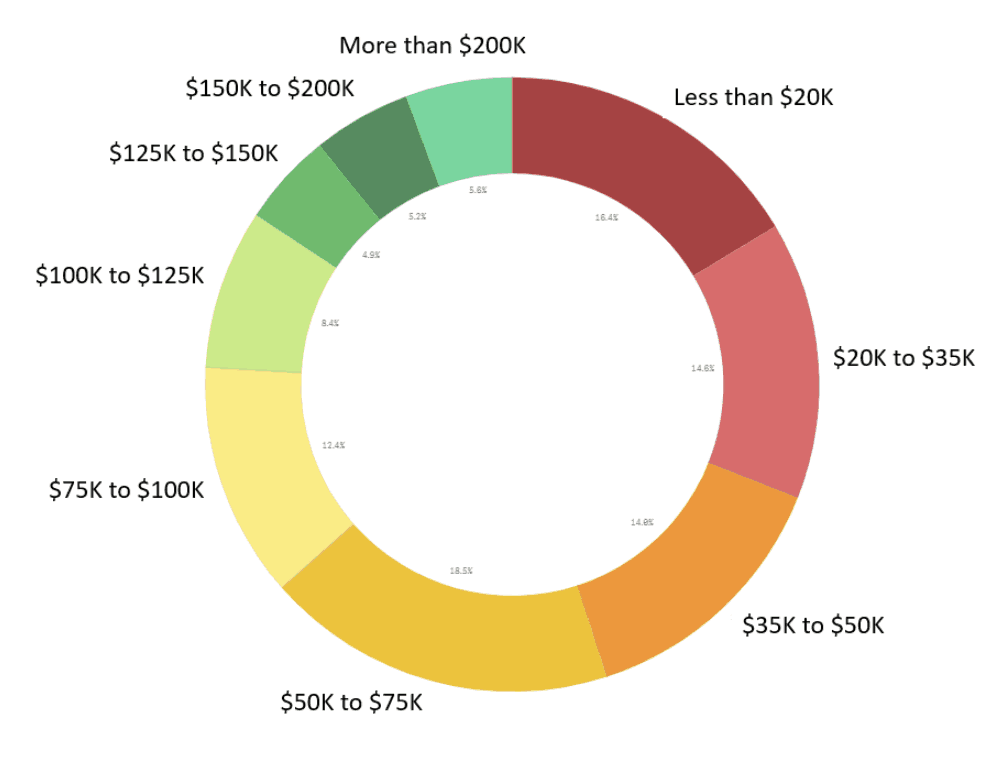
- People from a household with an income less than $35,000 a year make 26% of trips, while 30% of trips are made by people from a household with an income more than $100,000 a year.
- 66% of trips on Spring Street are more than 10 miles away from their home location, during the morning peak period.
Fig. 1: Home distribution of trips traveling on Spring Street.
In a region of almost six million people, Atlanta holds not even a tenth of that population. Armed with this level of information, city officials in places like Atlanta can be more informed when planning communicating with neighboring counties. Key takeaways from this quick study could inform a discussion about congestion pricing:
- The study’s demographic information highlights who will be impacted by congestion pricing.
- The volume data can help estimate the fee that could be collected through this program.
- Home locations can reveal areas where there are limited transit options, if congestion pricing negatively impacted certain demographic groups.
Fig. 2: Distribution of household income for Spring Street’s morning rush hour drivers.
As a next step, a planner could run the same analysis for all modes of travel for all roadways in Atlanta to get a more comprehensive picture of the travel pattern in the city. Reducing congestion is a hot topic for our customers, for Atlanta, and obviously for me.

