How to Avoid Dead-End Transportation Projects

Saving money and time during data collection is especially important to us at the Greater Madison Metropolitan Planning Organization (MPO) as we are collecting and analyzing data for an upcoming Transit Development Plan and concurrent redesign of the entire Metro system. As part of this plan, we are considering how to better serve minority and low-income communities, whose residents rely on transit disproportionately compared to other populations.
Obviously, the faster we can collect and analyze data, the faster we can assess it and head in a useful direction. The big advantage of working with on-demand transportation data at your desktop is that it allows you to quickly and easily set up and run these analyses. That efficiency helps us prioritize projects to optimize all of our resources.
Consider All the Options
At the Greater Madison MPO, we needed to research travel patterns within, ending in, and originating in Dane County, locus of the city of Madison. The ultimate goal was to identify transportation solutions to support low-income workers in our planning area.
One option we wanted to explore was how many employees traveled outside the county for work. A high number might indicate a need for a shuttle system to transport workers to large employers in outlying counties.
To explore this option, we would have typically mounted a survey to find out if there was a large concentration of commuters heading to specific destinations outside of the county.
This type of survey would have required countless hours to create, disseminate to residents, and analyze the results.
Quickly Rule Out Dead Ends
Instead, we turned to Big Data. We completed an Origin-Destination (O-D) analysis in StreetLight InSight® using our identified Environmental Justice (EJ) priority areas and gateways to and from Dane County. The analysis showed us how many people were leaving the county for work, which would help identify if there were any larger employers outside the county pulling a lot of people to jobs.
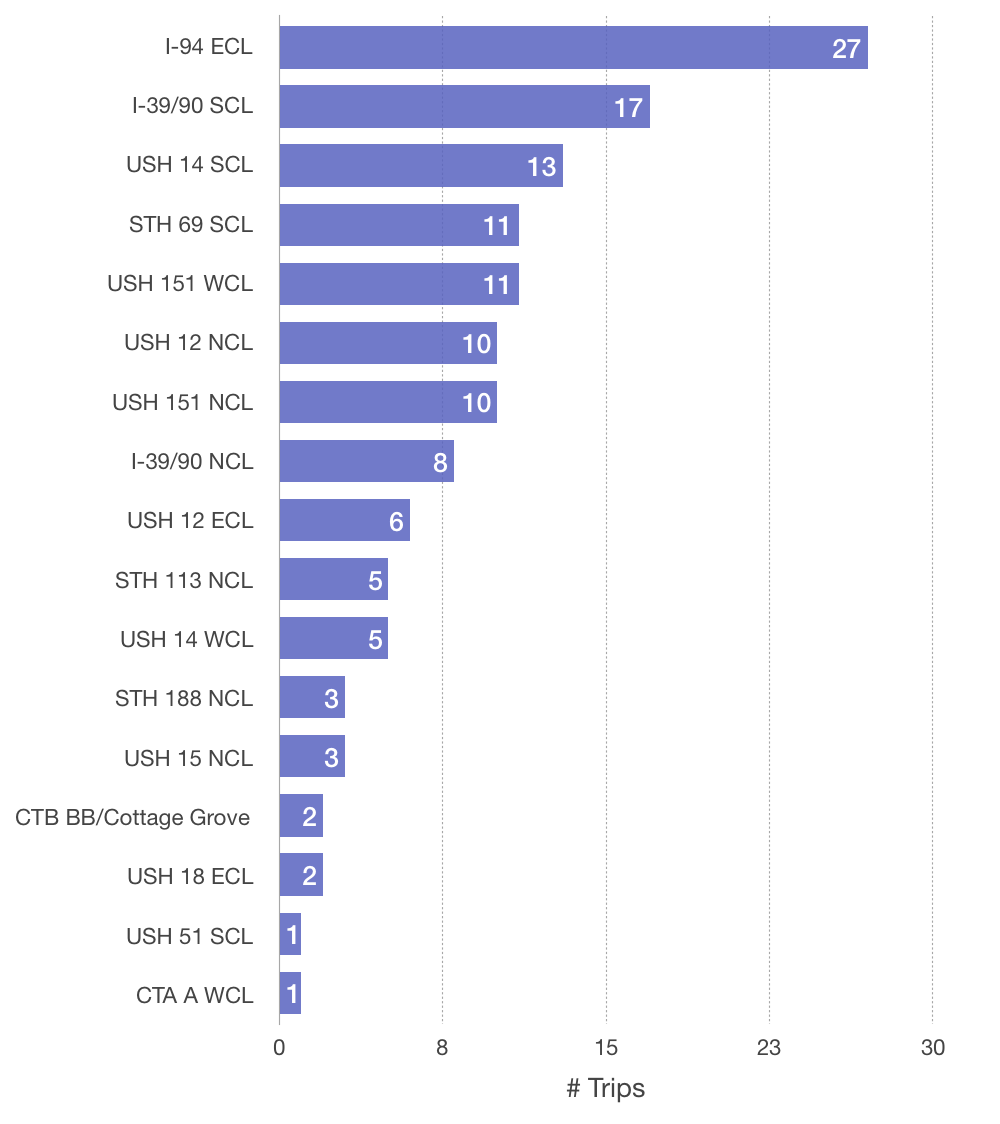
Figure 1: O-D traffic volume, by destination zone.
The results revealed that very few people from EJ priority areas left the county for work. As you can see in Figure 1, the destination area with the most activity had only 27 trips made over a 24-hour period. Given limited resources, we quickly determined that 27 trips was not enough demand to warrant further investigation of the potential for employee buses or shuttle services linking EJ priority areas to employers outside the county.
We could see immediately that it was an option that didn’t need further research.
Refocus Resources on Wins
While ‘dead ends’ like this are usually perceived as negative, in this case it was beneficial that we came to this conclusion so quickly. Within 10-15 minutes, we ruled out the need to further investigate travel patterns from EJ priority areas to employers outside the county, and moved onto investigating other travel patterns and how we could improve transportation options to better serve people living in EJ priority areas.
Because we saved resources upfront, we had the time and money to focus our attention on travel within Dane County and refine our research questions: When are people from particular EJ priority areas traveling within Dane County? Where are they traveling? How could buses or bike infrastructure improve their travel options?
Our big priority now is the transit development plan, and Big Data has provided important tools to make sure transit works for all of Madison’s population.
Ben Lyman is a transportation planner at the Greater Madison Metropolitan Planning Organization.
