Balancing Road Safety and Congestion in Oakland: Big Data Analysis Reveals Potential Solutions for a Dangerous Corridor
Part of Oakland’s High Injury Network, Grand Avenue was slated for a safety overhaul, but a 2023 plan for the roadway prioritizes vehicular throughput over traffic calming measures. Big data analyses can help planners and advocates maintain traffic flow and make streets safer for walking and biking.

Jump Ahead
In 2021, traffic fatalities in the U.S. reached a 16-year high with nearly 43,000 people killed, a 10.5% increase from 2020. In my hometown of Oakland, the Department of Transportation Director called traffic fatalities an ‘epidemic’, citing 35 deaths in 2022 — the highest number of fatalities in the last 10 years.
To address this, Oakland, like many state and local governments across the country, set in motion an effort to reduce these tragedies in their 2023 Strategic Plan, citing the following safety strategies:
- Adopt a Vision Zero policy and pledge to eliminate traffic injuries and deaths
- Inform safe designs and infrastructure decisions with data and analysis
- Incorporate safety and Complete Streets policies into road design processes
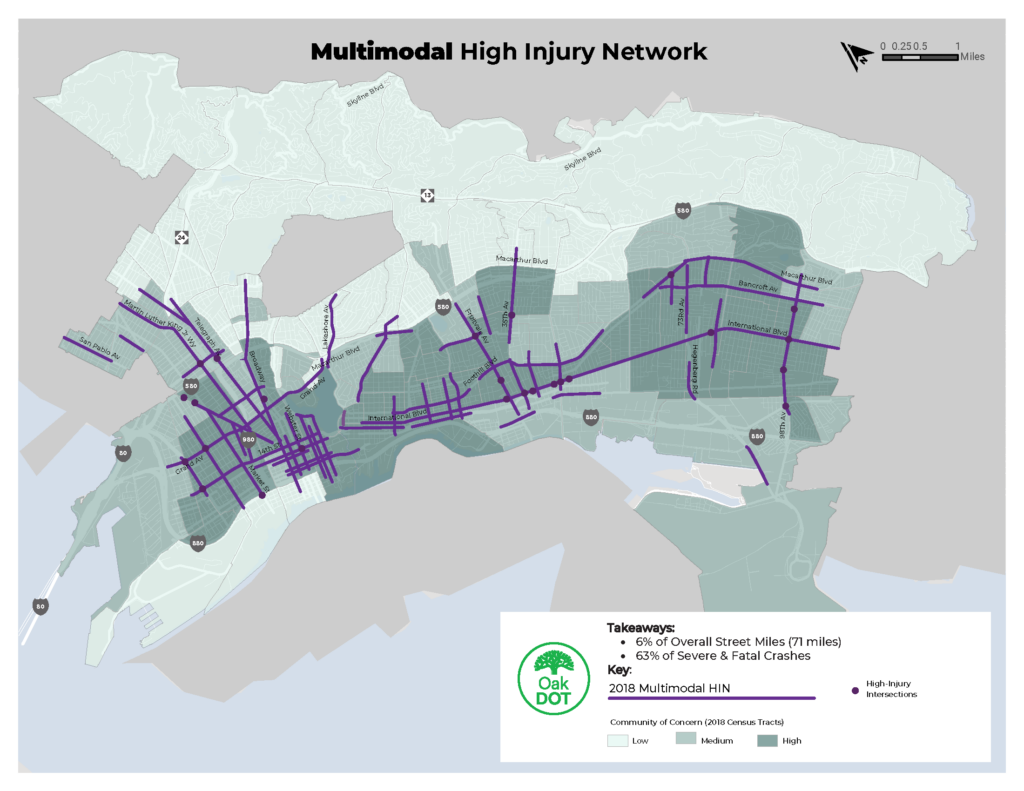
Grand Avenue is among Oakland’s most treasured corridors. It serves as a major connector between Downtown and residential neighborhoods, hosts major commercial businesses and destinations, and border’s Lake Merritt, Oakland’s most prominent recreational park. But it’s also on Oakland’s High Injury Network, a group of roadways that represent only 6% of street miles but account for 63% of severe and fatal crashes.[1] As a traffic safety advocate and lifetime resident in the East Bay, I was excited to learn a plan was underway to redesign Grand Avenue with safety in mind.
But in June 2023, a new plan for Grand Avenue was published — one that prioritizes vehicle throughput at the potential expense of non-vehicle road users like cyclists and pedestrians.[2] Confused by this new direction, I wanted to use my experience as a Product Manager of Data & Metrics at StreetLight to see if the data could support safety improvements that would still assuage concerns over congestion on Grand Avenue.
Below, I’ll share what my analyses uncovered, and explore how DOTs can use multimodal data to navigate the difficult job of aligning stakeholders and negotiating competing priorities. But to contextualize these findings, it’s important to first dive a little deeper on the history of Grand Avenue.
2018 Grand Avenue Mobility Plan Prioritizes Safety and Traffic Flow
In 2018, Oakland’s Department of Transportation (OakDOT) published the Grand Avenue Mobility Plan, a comprehensive study that used a collection of data sources — including community engagement surveys and StreetLight’s Trip Speed, Roadway Volumes, and Origin-Destination Metrics — to take stock of the mobility, economic, and demographic conditions along Grand and present various redesign options.
The report states that the top two local goals are to “Serve existing residents’ transportation needs, and to improve the safety and comfort of those walking and biking along and across the corridor.” Taken together, these two goals speak to a nuanced and challenging balancing act that urban transportation professionals are constantly navigating: Should a corridor’s design prioritize the movement of vehicles or the safety and comfort of those not in vehicles?
These two goals can often seem at odds, but they don’t have to be.
We know that vehicle speed is among the biggest factors impacting the frequency and severity of crashes that kill and injure pedestrians and cyclists. For this reason, traffic calming measures — road design and operations strategies that reduce vehicle speeds — can have a huge positive impact on road safety. But constituents often ask: will slower traffic speeds mean more congestion?
While infrastructure and operations that benefit walkers and bikers — like bike lanes and reduced speed limits — can raise concerns over congestion and traffic delays, a deeper understanding of existing conditions can often reveal road design options that benefit both drivers and those outside vehicles.
But planners and engineers need robust, multimodal data to weigh all the options.
Existing Conditions on Grand Avenue: Broadway to Grand Lake Theatre
Of the corridor’s four sections, the stretch that connects Uptown to the Grand Lake Theater, which defines the northern border of the lake and park, is the first that will undergo a redesign. This section serves restaurants, businesses, visitors to the park, and the residents of the Adams Point neighborhood. It also connects downtown Oakland to the Hills neighborhoods and highway 580.
As of June 2023, the plan is at the 35% stage, and construction could begin as soon as 2024. [3]
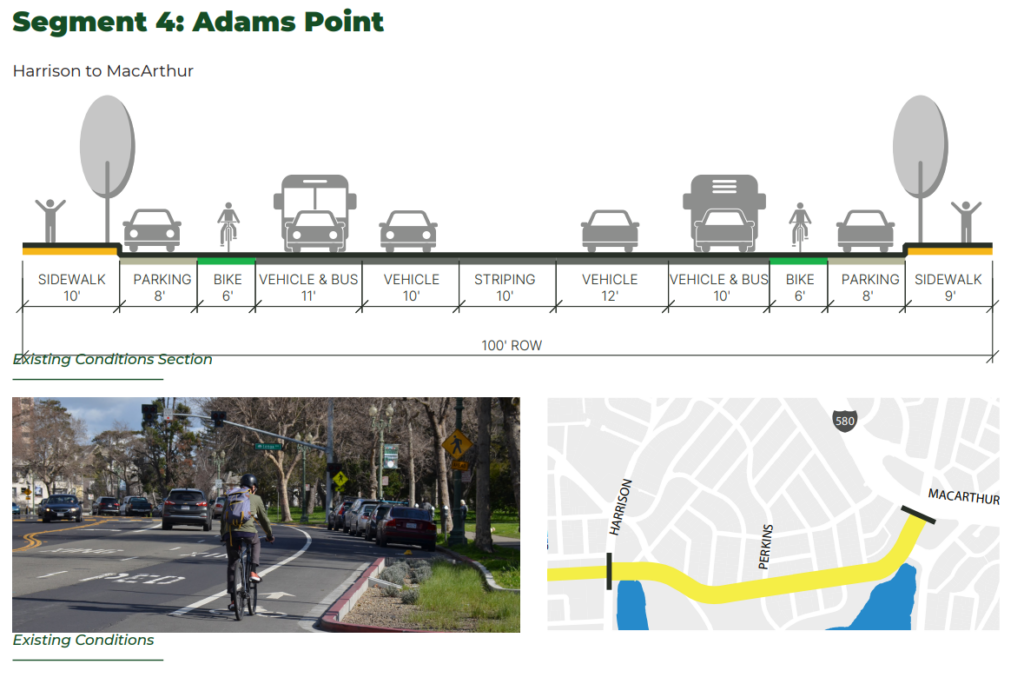
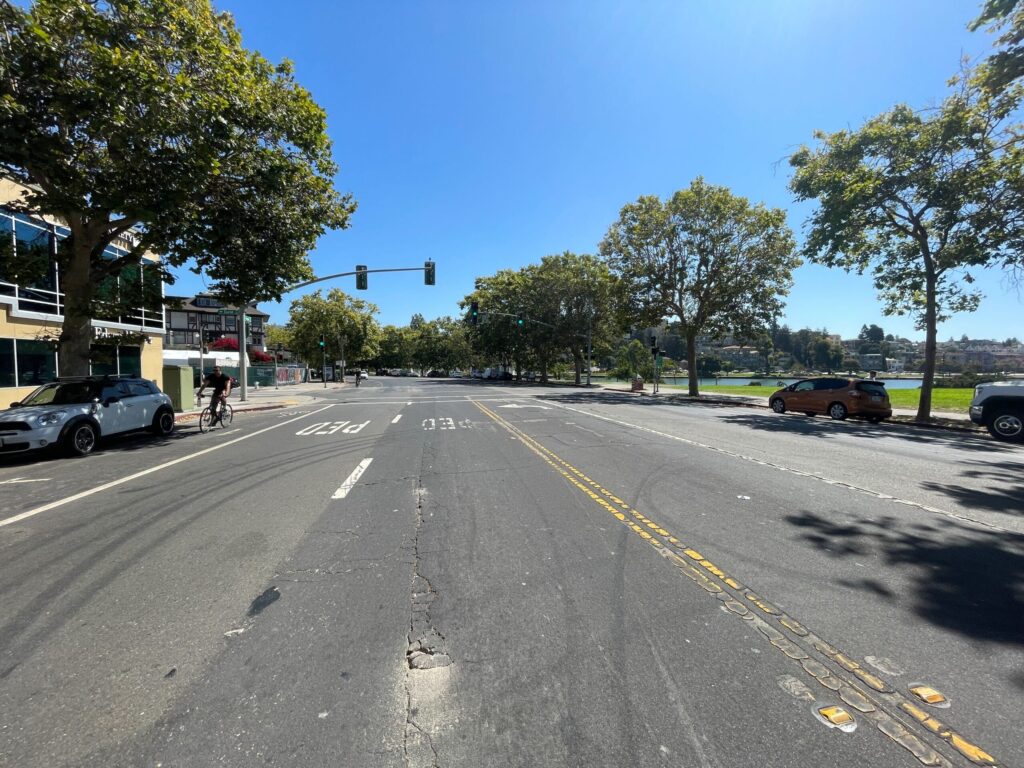
Existing conditions along the corridor feature two multi-use travel lanes, a center turn lane, as well as unprotected bike lanes and parking on each side. There are signalized crossings, but they are spaced far away and do not feature pedestrian islands at the median. Meanwhile, there are also very few curb bulb-outs, which function to improve safety by reducing crossing distance.
Importantly, the existing two travel lanes allow cars to travel quickly and unpredictably, making conditions unsafe for bicyclists and pedestrians. In San Francisco, a 2023 study from SFMTA showed that while 4+ lane roads were only 14% of the network, they constitute 53% of the collisions with bicyclists.[4]
The 2018 Grand Avenue Mobility Plan proposes multiple redesign alternatives, most of which include traffic calming measures that would reduce the number of vehicle lanes and repurpose roadway space for non-car travel such as bus and bike lanes or protected pedestrian medians. This type of roadway treatment is commonly referred to as a road diet — a traffic calming tactic that is proven to improve road safety, though it often prompts concerns over traffic congestion.
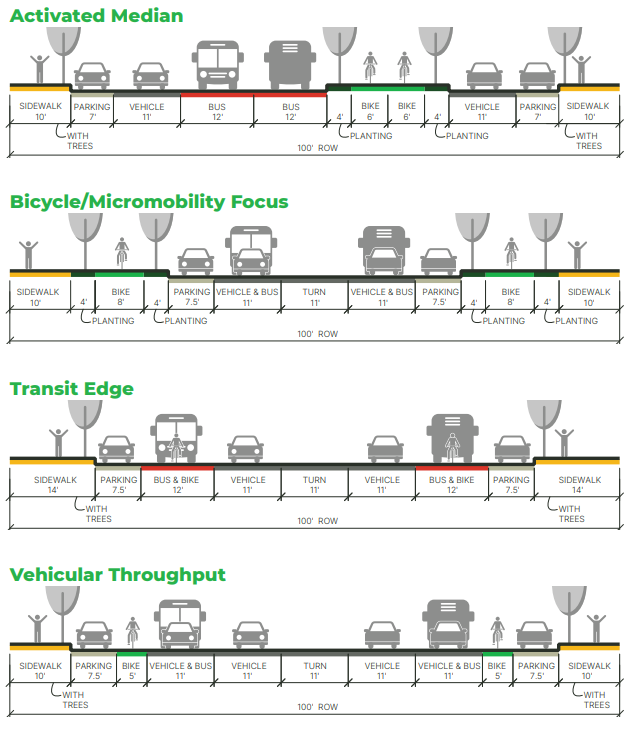
Given the documented dangers of 4-lane roads and scarcity of existing infrastructure on Grand protecting pedestrians and cyclists, it makes sense that in the 2018 Plan, the most popular option was the Bicycle/Micromobility focus.
However, while earlier design stages maintained this emphasis on calming traffic and improving bike and pedestrian safety, the 35% designs published June 2023 focused on Vehicular Throughput instead.
There are many competing pressures that may have caused this reversal, but the most likely driver of a decision like this is the concern that vehicle volumes are too high for a single lane, resulting in poor Level of Service and congested traffic.
When considering changes to the road design, each corridor needs to be analyzed carefully to balance the needs of motorists, pedestrians, bicycles, transit, and other roadway users. This is where having access to better data can help practitioners pinpoint problem areas and determine how to create a design that avoids gridlock, but also promotes safety.
See which U.S. regions are recovering from a nationwide decline in walking
Download ReportAnalyzing Grand Avenue’s Current Traffic Conditions With Big Data
Generally, the safety on an urban collector like Grand boils down to pedestrian exposure to vehicles moving at high speeds. In the following analysis, I use StreetLight to examine conditions on Grand with the purpose of illustrating whether a road diet treatment — including reducing the lanes and speeds of vehicles — is appropriate, and how it would impact both pedestrian safety and congestion.
To do so, we must answer these fundamental questions:
- Where is pedestrian activity highest?
- Are vehicle speeds unsafe and where are vehicle speeds highest?
- Do vehicular volumes warrant having two lanes in each direction?
Pedestrian Exposure on Grand
My first step was to identify where the most pedestrians are exposed to high-speed vehicles. To do this, I analyzed pedestrian activity at each intersection and overlayed vehicle speeding patterns. Measuring relative pedestrian activity can help transportation planners know where safety-focused interventions can have the highest impact.
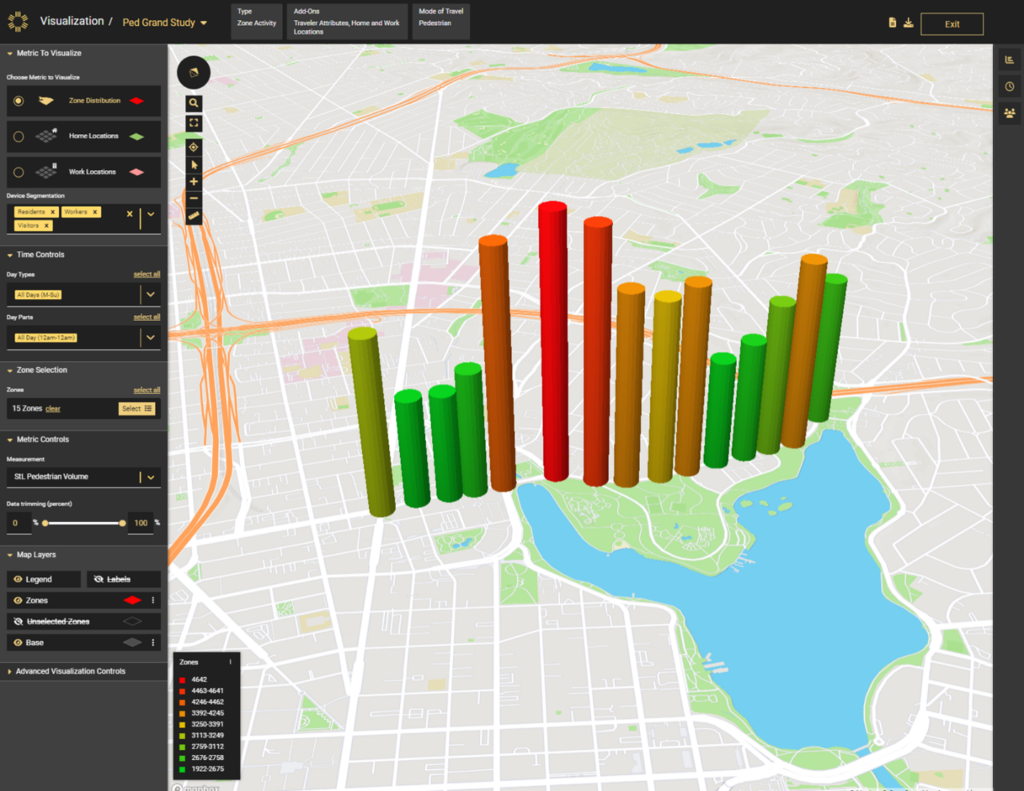
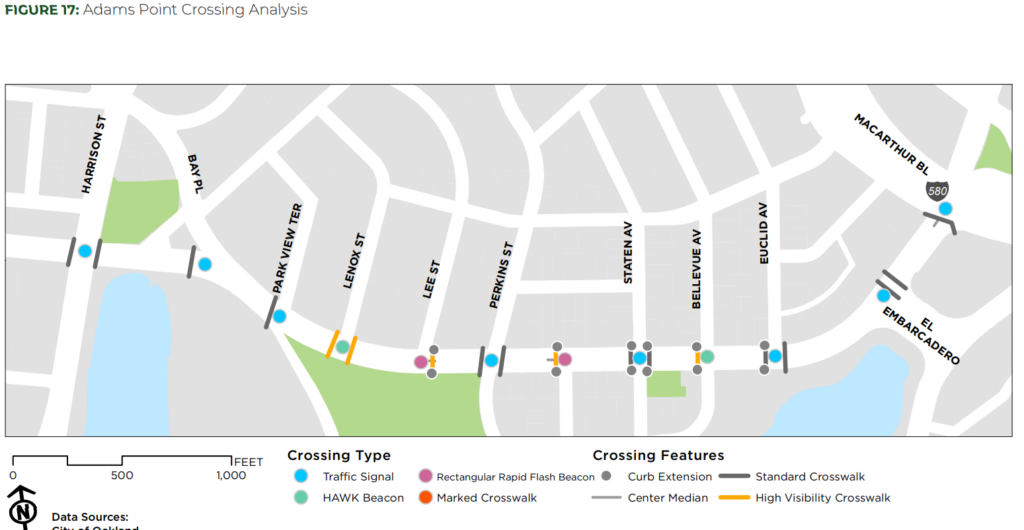
In the map above, you can see that the highest pedestrian activity closely aligns with the section of Grand that borders the park. The other outlier is on the east corner of the lake, which is the intersection with the largest distance between crossing features such as curb extensions, center medians, or crosswalks (shown below).
The second step is to analyze vehicle speeds on the corridor, to determine where and when vehicle speeds are dangerous. StreetLight can be used to analyze the 85th and 95th percentile speeds, the standard method for measuring speeding vehicles.
For this analysis, I’ve zeroed in on weekdays from 8-9am, when families are walking to school and people are commuting, as well as weekend days from 12-1 pm, when people are visiting the park.
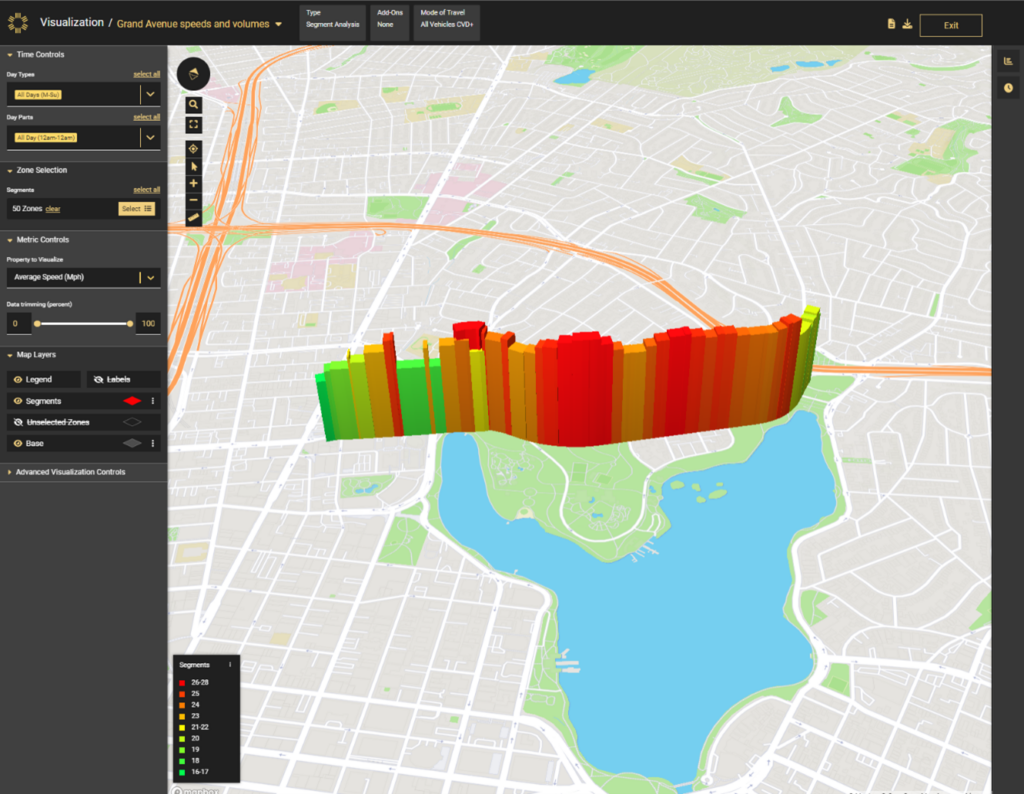
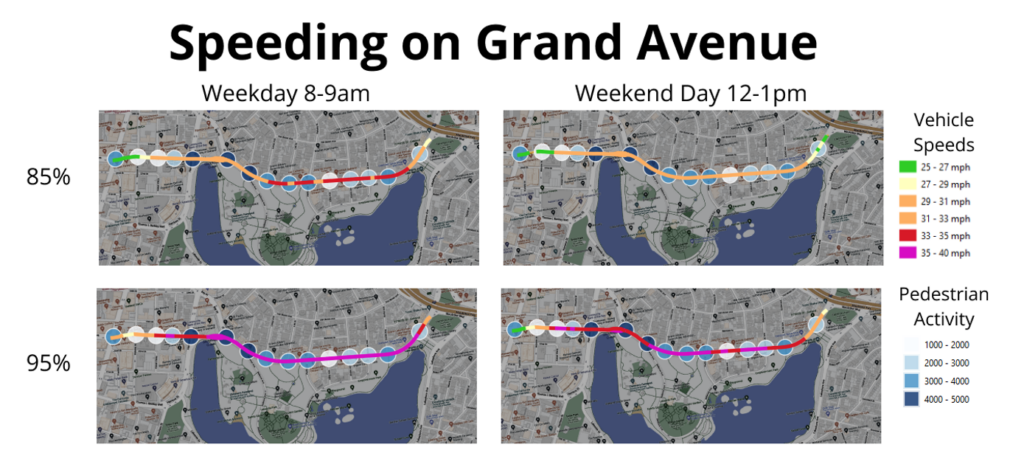
Looking at the 95th percentile, the data shows that vehicles are often speeding in excess of 10 MPH above the speed limit during critical hours. Importantly, by overlaying the speed and pedestrian activity, it’s clear that the same areas with the most pedestrian activity also exhibit dangerous speeds.
Exposure analysis like this reveals precisely where the highest value interventions could be made. Pedestrian median islands, bulb outs, and high-visibility crosswalks are among the tools planners use to improve safety with or without reducing lanes.
Beyond these pedestrian safety features, the most effective way to reduce fatalities is to reduce speed, which is where concerns about congestion often surface. That’s because vehicle speeds and roadway capacity are interconnected — a phenomenon that was highlighted during the COVID pandemic, when a drop in vehicle volumes increased the rate of speeding.
To put it simply, when there is excess capacity, drivers will tend to use the extra space to move more quickly. Conversely, when there is less room for vehicles, drivers will tend to slow down.
This is where a deeper dive into vehicle travel patterns on Grand Avenue and adjacent roadways can help evaluate the corridor for lane reduction.
Vehicle Capacity on Grand
When considering how many lanes a corridor should have, traffic engineers will typically look at each direction separately and use the maximum hourly volume to determine the appropriate treatment that avoids congestion. The Federal Highway Administration Road Diet Informational Guide suggests that urban arterial lanes can likely support 750 Vehicles Per Hour (VPH), and possibly up to 875 VPH, but it depends on signal spacing, presence of turning lanes, and other factors.[5]
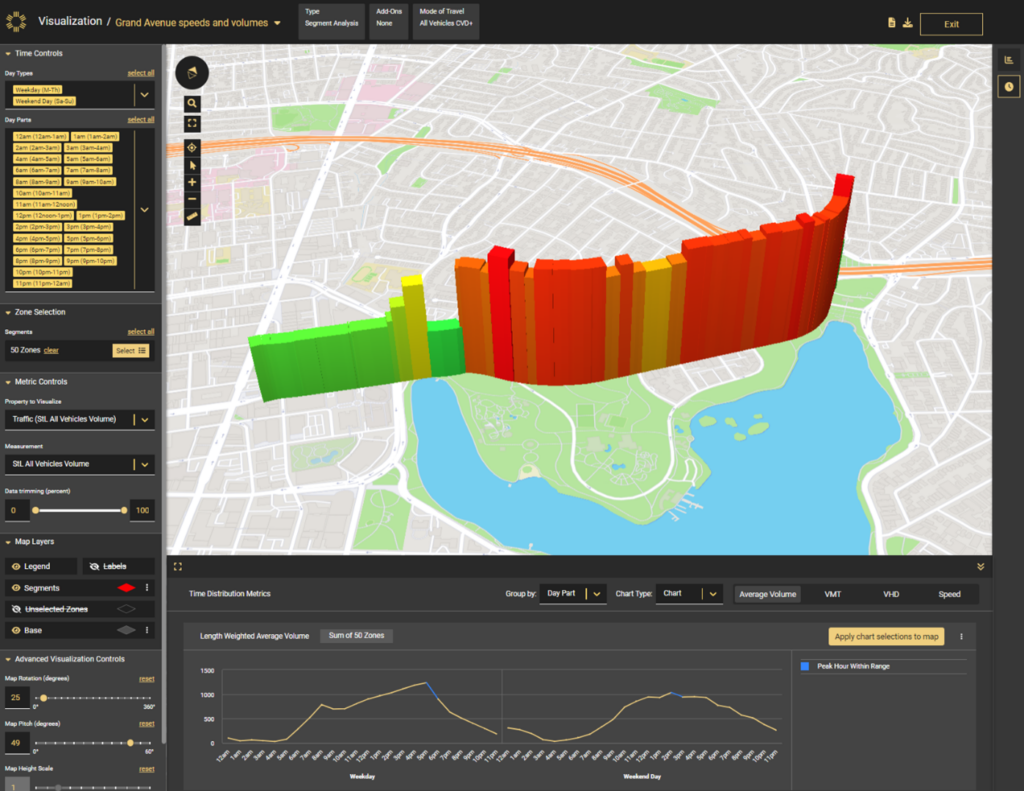
To study optimal road capacity, first we need to look at how volumes change across the corridor. The image above shows that the corridor can reasonably be divided into two segments with distinct volumes, one along the lakefront, and one from the lake towards downtown. The hourly trends (seen at the bottom of the image) show that traffic peaks on weekdays between 5 and 6 p.m.
Next, the chart below shows how hourly volumes fluctuate during the weekday and weekend day, for each direction.

The data shows that while most of the day falls below 875 VPH, weekday evening commute hours reach above the threshold recommended for 1-lane corridors. Therefore, according to traditional approaches to capacity planning, with no other changes to expected driving behavior, reducing the travel to one lane would likely cause congestion during those hours.
However, what the capacity benchmark fails to take into account is how traffic would organically reroute to underutilized roadways. Here, Streetlight can be used to understand through traffic behavior, as well as understand nearby capacity and whether it’s likely to help offset capacity changes on Grand.

The charts above show where people on Grand are coming from and headed to. On average, around 25% of vehicles are using Grand to get to Highway 580. During the peak hour, when congestion would occur, that number jumps to 30%. Furthermore, looking at where traffic is coming from, it’s noteworthy that 20% of peak hour traffic on Grand originates as far west as Martin Luther King Jr. Blvd.

While current conditions indicate that reducing the number of lanes risks congestion during peak hours, there is also evidence that much of this traffic is headed to the freeway and would end up naturally re-routing away from Grand Avenue. Further analysis should be done on the roadways where this traffic is expected to be diverted to determine if they have the capacity to take on the additional traffic.It should be noted that beyond keeping the current number of lanes, there are other ways to manage congestion, like retiming traffic signals or implementing a parking-convertible traffic lane during the heavily trafficked evening commute hour. Finally, and importantly, congestion can be reduced by promoting modeshift to transit and active transportation.
Based on my analysis, there is reason to suspect that a road diet on Grand Ave. could still be a viable solution to safety concerns along this high-injury roadway, and may merit particular consideration on the areas of the roadway where high pedestrian activity and high speeds dangerously coincide.
Although traffic flow and pedestrian safety on Grand may appear to be in conflict, access to robust mobility data for this and adjacent corridors helps reveal road design alternatives that accommodate both.
Vehicle metrics shown here were collected from January to April 2023. Pedestrian activity was collected from November-April 2022.
1. https://cao-94612.s3.amazonaws.com/documents/ALL-HINs.pdf
2. https://cao-94612.s3.amazonaws.com/documents/GAMP-final-02-28-22.pdf
3. https://cao-94612.s3.amazonaws.com/documents/Grand-Ave-35.pdf
4. https://www.sfmta.com/sites/default/files/reports-and-documents/2023/07/8-1-23_mtab_item_11_active_communities_plan_update.pdf
5. https://safety.fhwa.dot.gov/road_diets/guidance/info_guide/ch3.cfm#n38

Try out StreetLight's transportation analytics for free with a trial of our AADT metrics
Request your Free TrialReady to dive deeper and join the conversation?
Explore the resources listed above and don’t hesitate to reach out if you have any questions. We’re committed to fostering a collaborative community of transportation professionals dedicated to building a better future for our cities and communities.