Commutes Across America – Where are the Longest Trips to Work? Part 1

Are you tired of the long drive to and from work? This is probably the most tiresome, frustrating part of your day. And, you’re not alone. Everyone on the roadway probably feels the same!
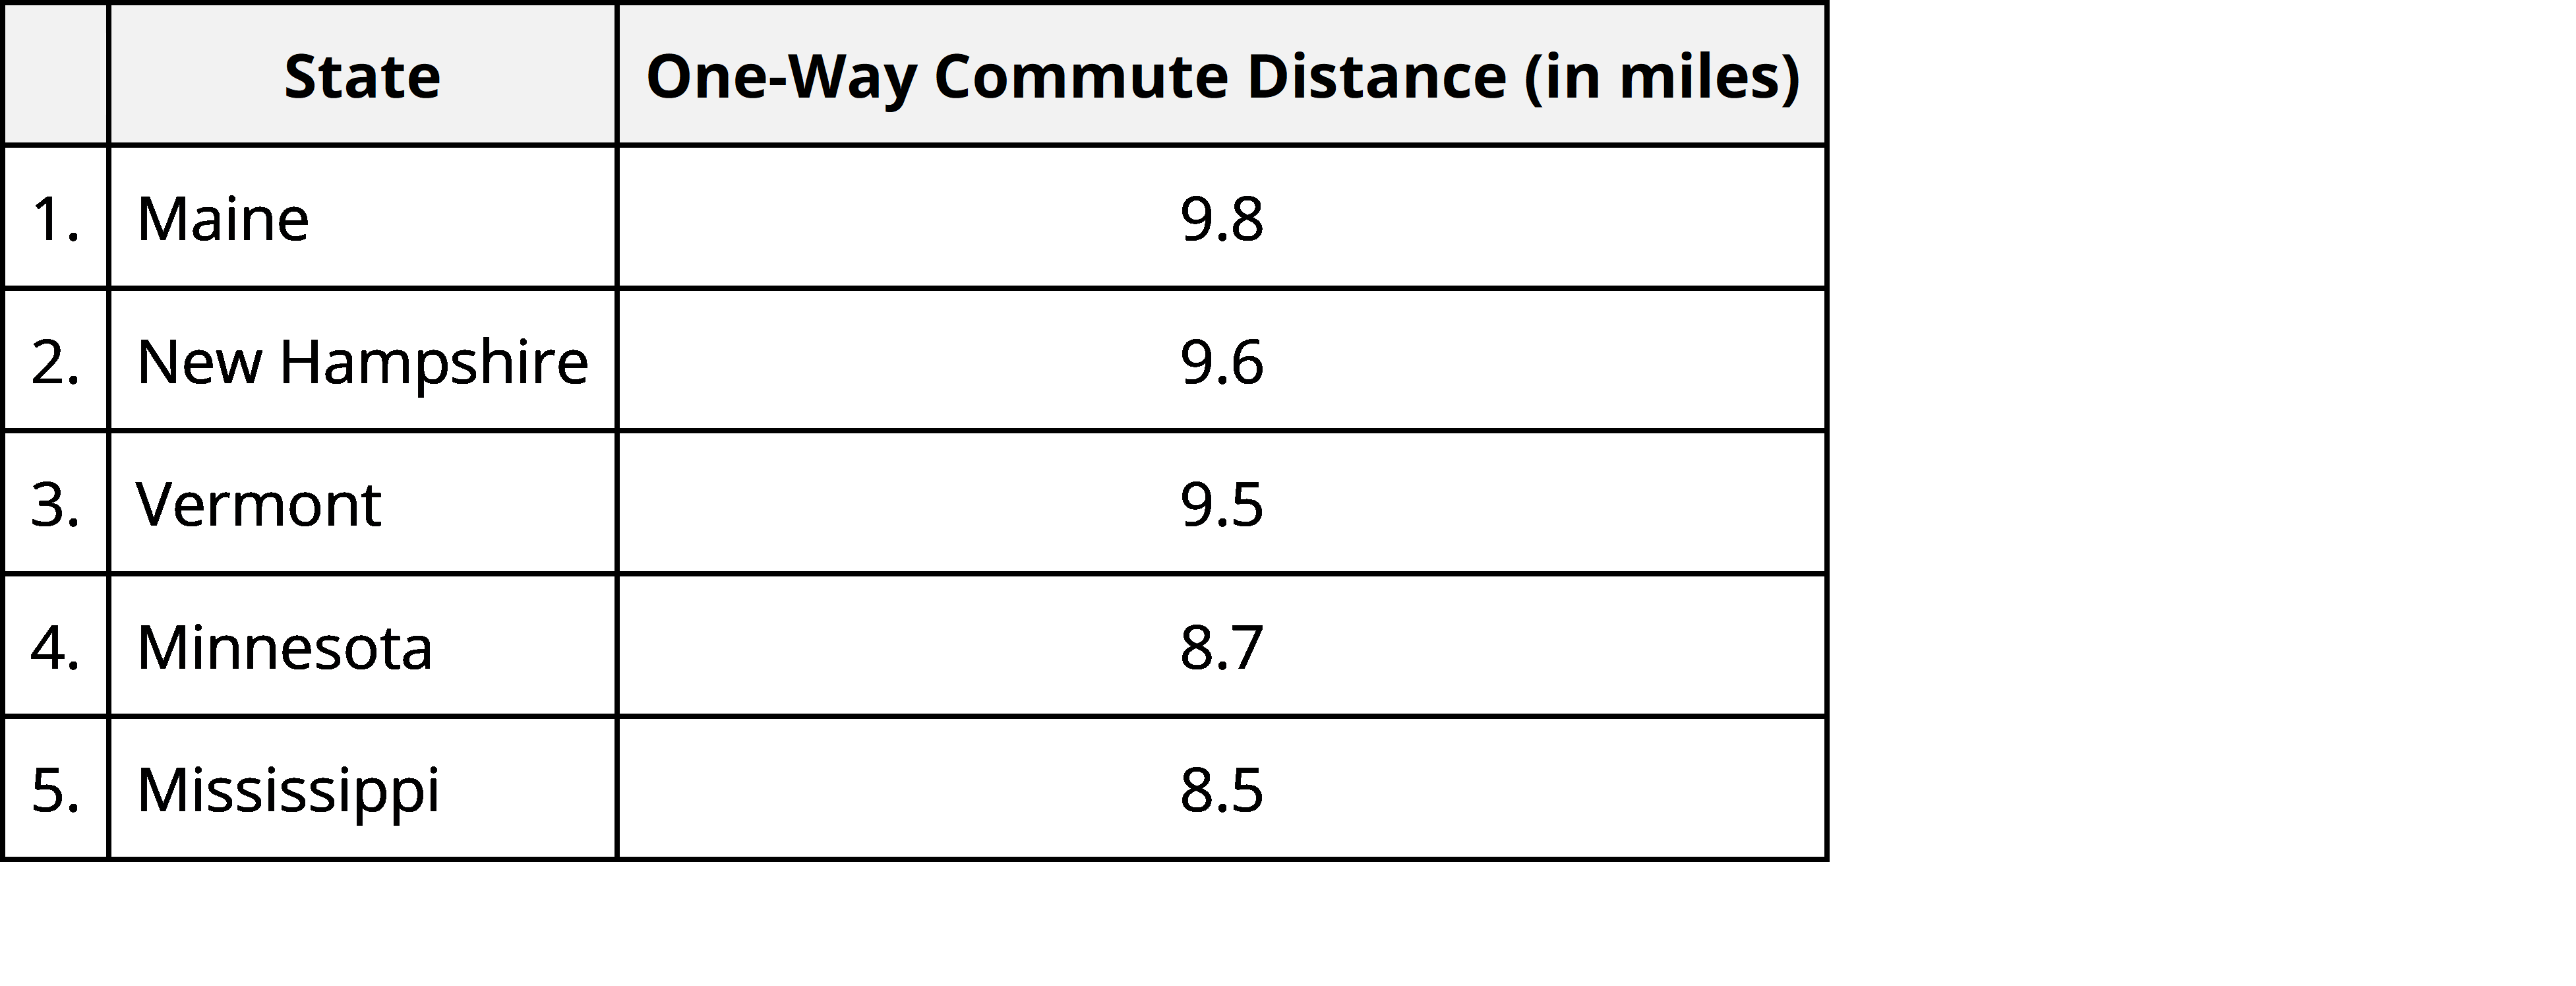
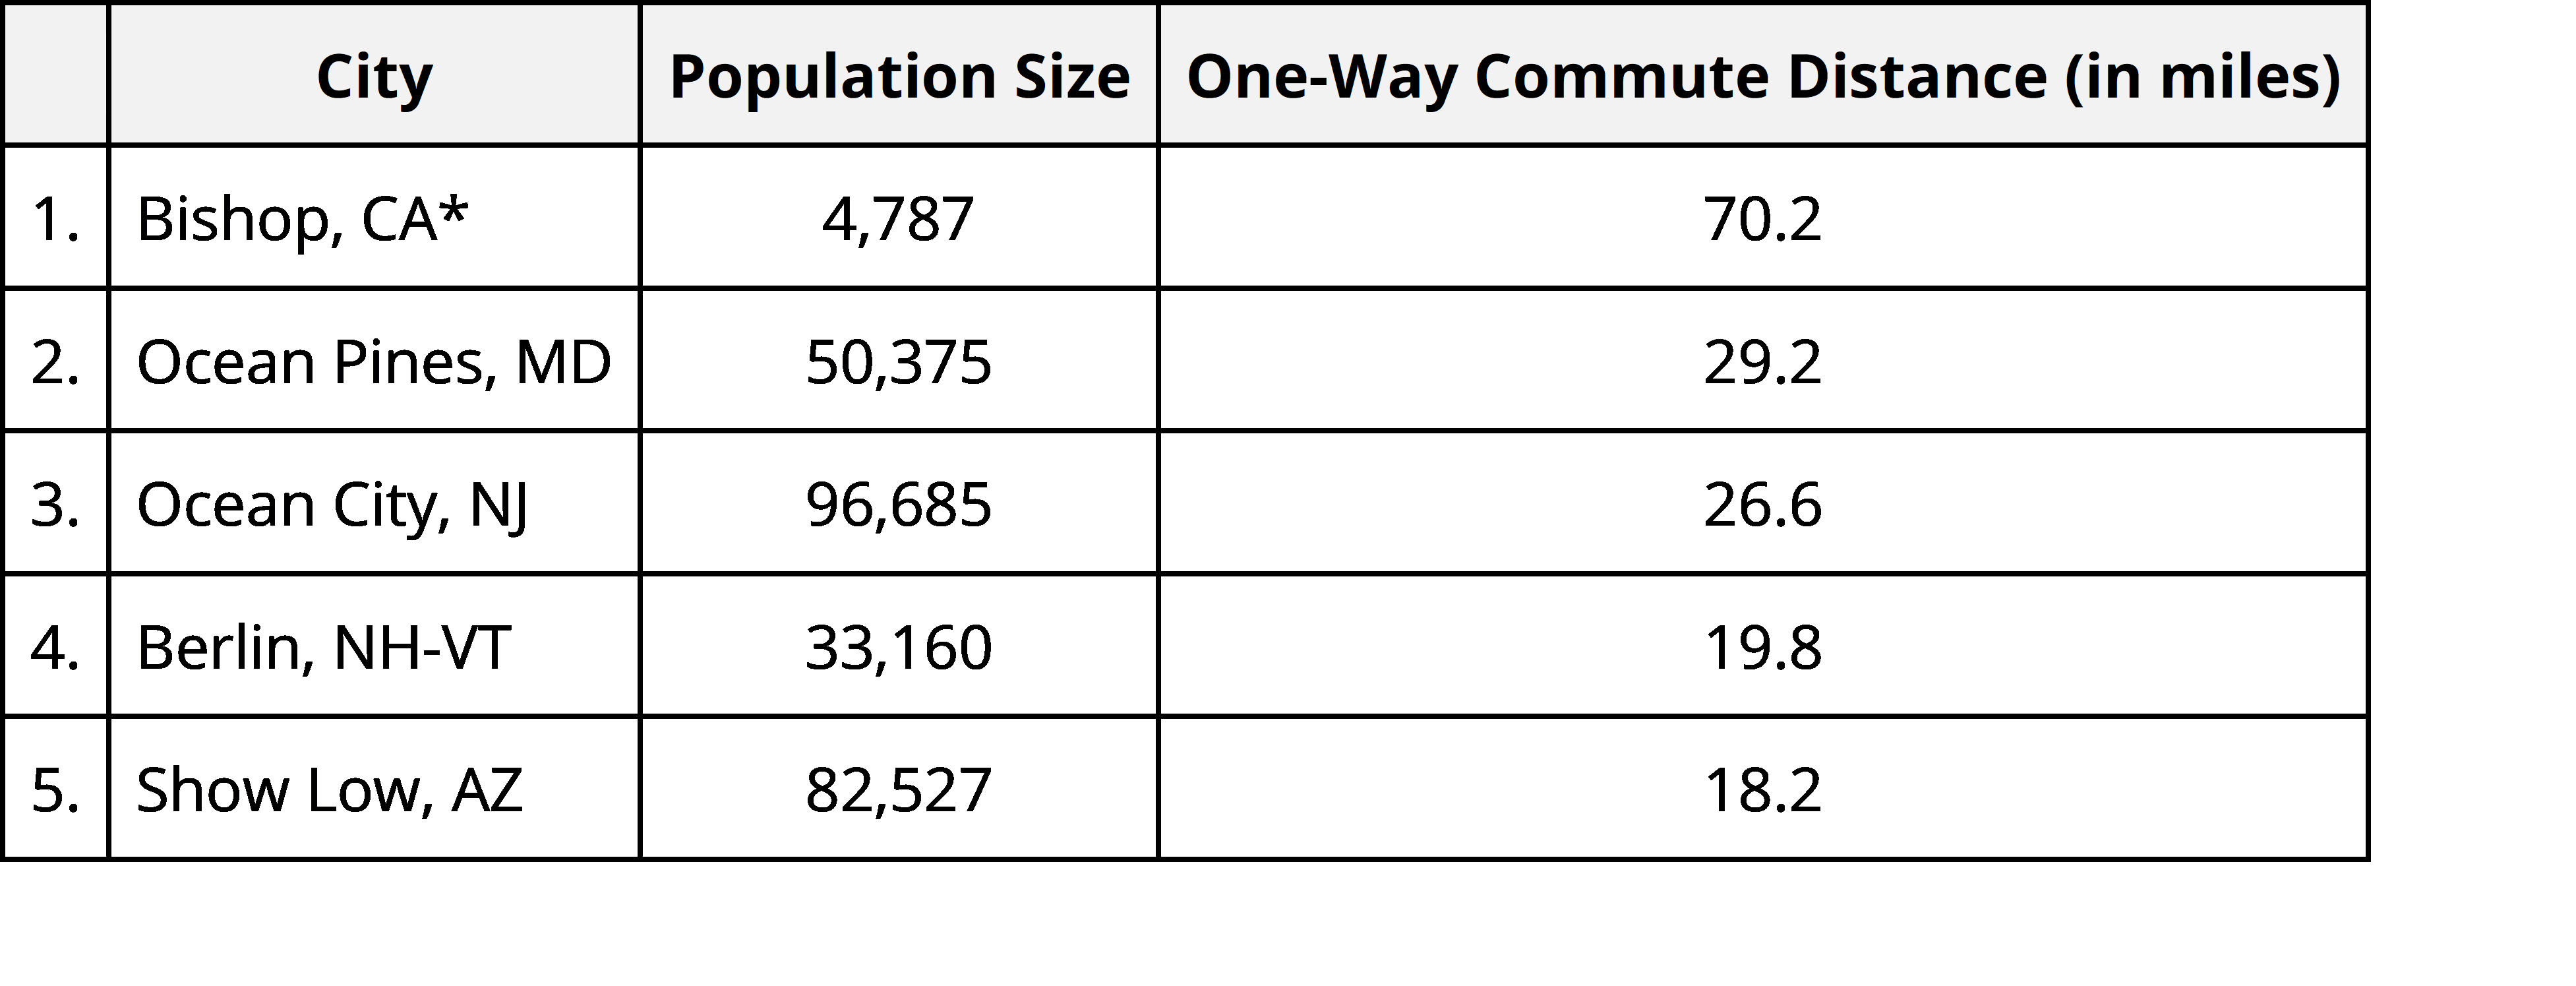
To better understand commutes across America, StreetLight Data has compiled information on where commutes are the longest. Explore this article to find out why it’s important to understand commute travel patterns and to discover the top five states and cities with the longest commutes.
4 Reasons Why Understanding Commutes Matters
1. Commutes Impact Happiness and Health
As you sit in your car during your commute to or from work, you probably feel frustrated and stressed. Aside from being an inconvenience, a long commute could actually impact your health and happiness, too.
First, it’s important to note that the average American professional spends about 52 minutes commuting each day, according to the U.S. Census. That’s a lot of time that could be spent in better, more productive ways. You could be with your family, or even getting more work done. Instead, you’re commuting.
Next, let’s look at the impact of commutes on your health. According to a study in the American Journal of Preventative Medicine, commutes longer than ten miles have negative impacts on cardiovascular health. “The study found that people who drove longer distances to work reported less frequent participation in moderate to vigorous physical activity and decreased CRF (cardiorespiratory fitness), and had greater BMI (body mass index), waist circumference, and blood pressure.”
Finally, your happiness is at stake, too. In another study from National Geographic fellow Dan Buettner, it was reported that “if you can cut an hour-long commute each way out of your life, it’s the [happiness] equivalent of making up an extra $40,000 a year if you’re at the $50- to $60,000 level.” While a longer commute for a certain job may add more money to your bank account, it also reduces happiness from your life.


2. Commutes Contribute to Economic Inequality
Why do people drive so far to work? Many people commute just to have a job or to have a job that pays well. Others commute from suburban areas with lower costs of living to urban areas with more business and greater job opportunities.
So, how does this perpetuate economic inequality? Commutes cost money and time. If workers are expected to travel 20+ miles every day to get to work, that might not be a sustainable lifestyle. By looking at commute data, governments can step in and take action to close the accessibility gap.
3. Commutes Have an Environmental Impact
The longer you’re in your car during a commute, the more carbon dioxide your vehicle is emitting into the air. In fact, motor vehicles emit 20 pounds of carbon dioxide per gallon of gas burned. That translates into a national average of 5.5 tons of carbon dioxide emission a year for every motorist. Those emissions have a huge impact on the environment.
While there are options to cut down on the environmental impacts of commuting, like carpooling, telecommuting, or public transit, most people – 77% of motorists – still drive alone to work. And, work-related driving is responsible for nearly 30% of miles traveled in a vehicle. To cut down on those numbers, transportation planners need a better understanding of what commutes across America look like.
4. Commutes Should be Put in Context
Finally, it’s important to understand your community’s commute in context. How does your area stack up against other states and cities? Answering this question helps two groups. First, it’s crucial information for urban planners. When urban planners understand their community’s commute in context, they’re better able to identify what changes need to be made, and where they’re doing things right. Looking at similarly sized cities can reveal alternative transportation methods that could work in your own city.
Understanding commutes to work in context can also help workers make informed decisions for the future. While everyone feels like their commute is unbearable, the number might show that it could be worse. If your commute is better than those around you, you might stay at your job longer. If your commute is longer than your average commute, you might begin searching for a new job closer to home.
Commutes Compared: States and Cities
Now that you have a better understanding of why we think researching data on traveling commutes is important, let’s look at the states and cities whose drivers commute the longest distances.
Top 5 States with the Longest Commutes
Top 5 Cities (CBSAs) with the Longest Commutes
To understand city-wide travel patterns, we looked at CBSAs, or core-based statistical areas, which are a census designation for “one or more counties anchored by an urban center of at least 10,000 people,” plus neighboring counties with socioeconomic links to the urban center due to commuting. Keep in mind that statistics related to low population areas can be heavily impacted by a small number of commuters who drive long distances.
Why this Data Matters and How to Put Big Data to Work for Your Transportation Projects
Commuter data is key to finding actionable solutions for the problem. With these insights, transportation and urban planners are equipped to make insightful decisions regarding transportation planning for the future. These data points also reveal areas that may need extra attention to make commutes to and from work shorter.
Consider incorporating Big Data analytics into your transportation and urban planning process. When you do, you’ll have better insights into the commuting habits of your community, and you can find solutions to alleviate the burden of their commutes. For more information on this topic, check out the blog next week to read part two of this series on commutes across America.

