Evaluating Road Diets Before u0026 After with Big Data

In this blog post, we highlight how to use Big Data to measure the performance of transportation policies and infrastructure projects. Since we’re deeply concerned by the rise in traffic fatalities in 2015, we decided to evaluate the performance of a popular safety measure: a road diet.
According to DOT, a road diet removes one or more motor vehicle lanes from a highway and replaces it with protected bike lanes, expanded shoulders, sidewalks, raised medians, and/or center turn lanes. As our case study for measuring road diets’ performance, we analyzed Seattle’s Rainier Avenue (See Figure 1 below) with StreetLight InSight®. StreetLight InSight is our easy-to-use web application for transforming Big Data from mobile devices into Metrics that describe aggregated travel patterns.

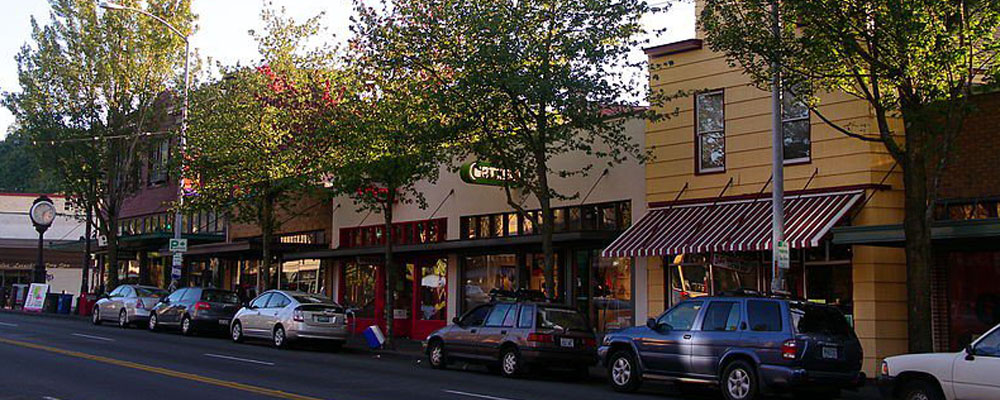
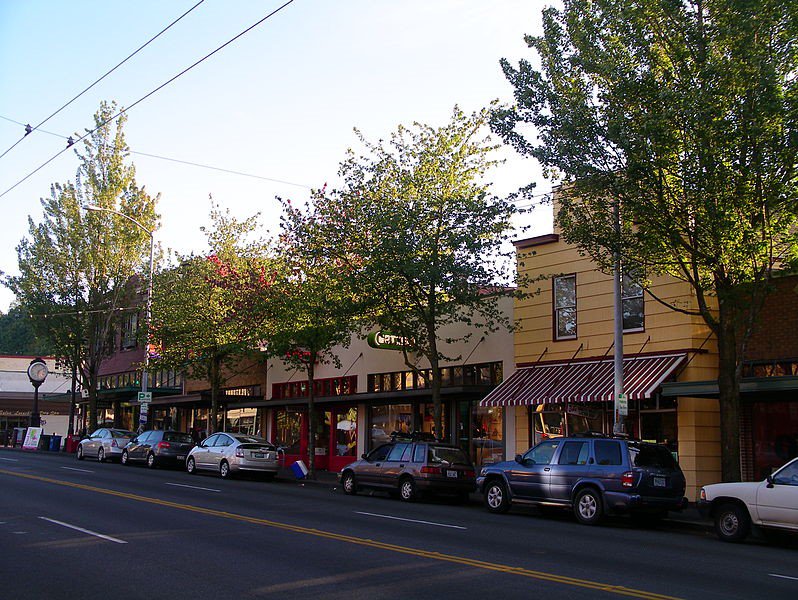
Figure 1: Rainier Avenue in September 2008, well before the road diet. (Source: Matt Grundy, Wikimedia Commons)
Rainier Avenue: Putting A Dangerous Road on a Diet
Known for having an average of one crash per day for the last ten years, Rainier Avenue was once in the running for Washington State’s most dangerous street. In 2015 alone, eight business on the road were hit by vehicles, and nearly 630 people were injured in accidents (Source: The Seattle Bike Blog).
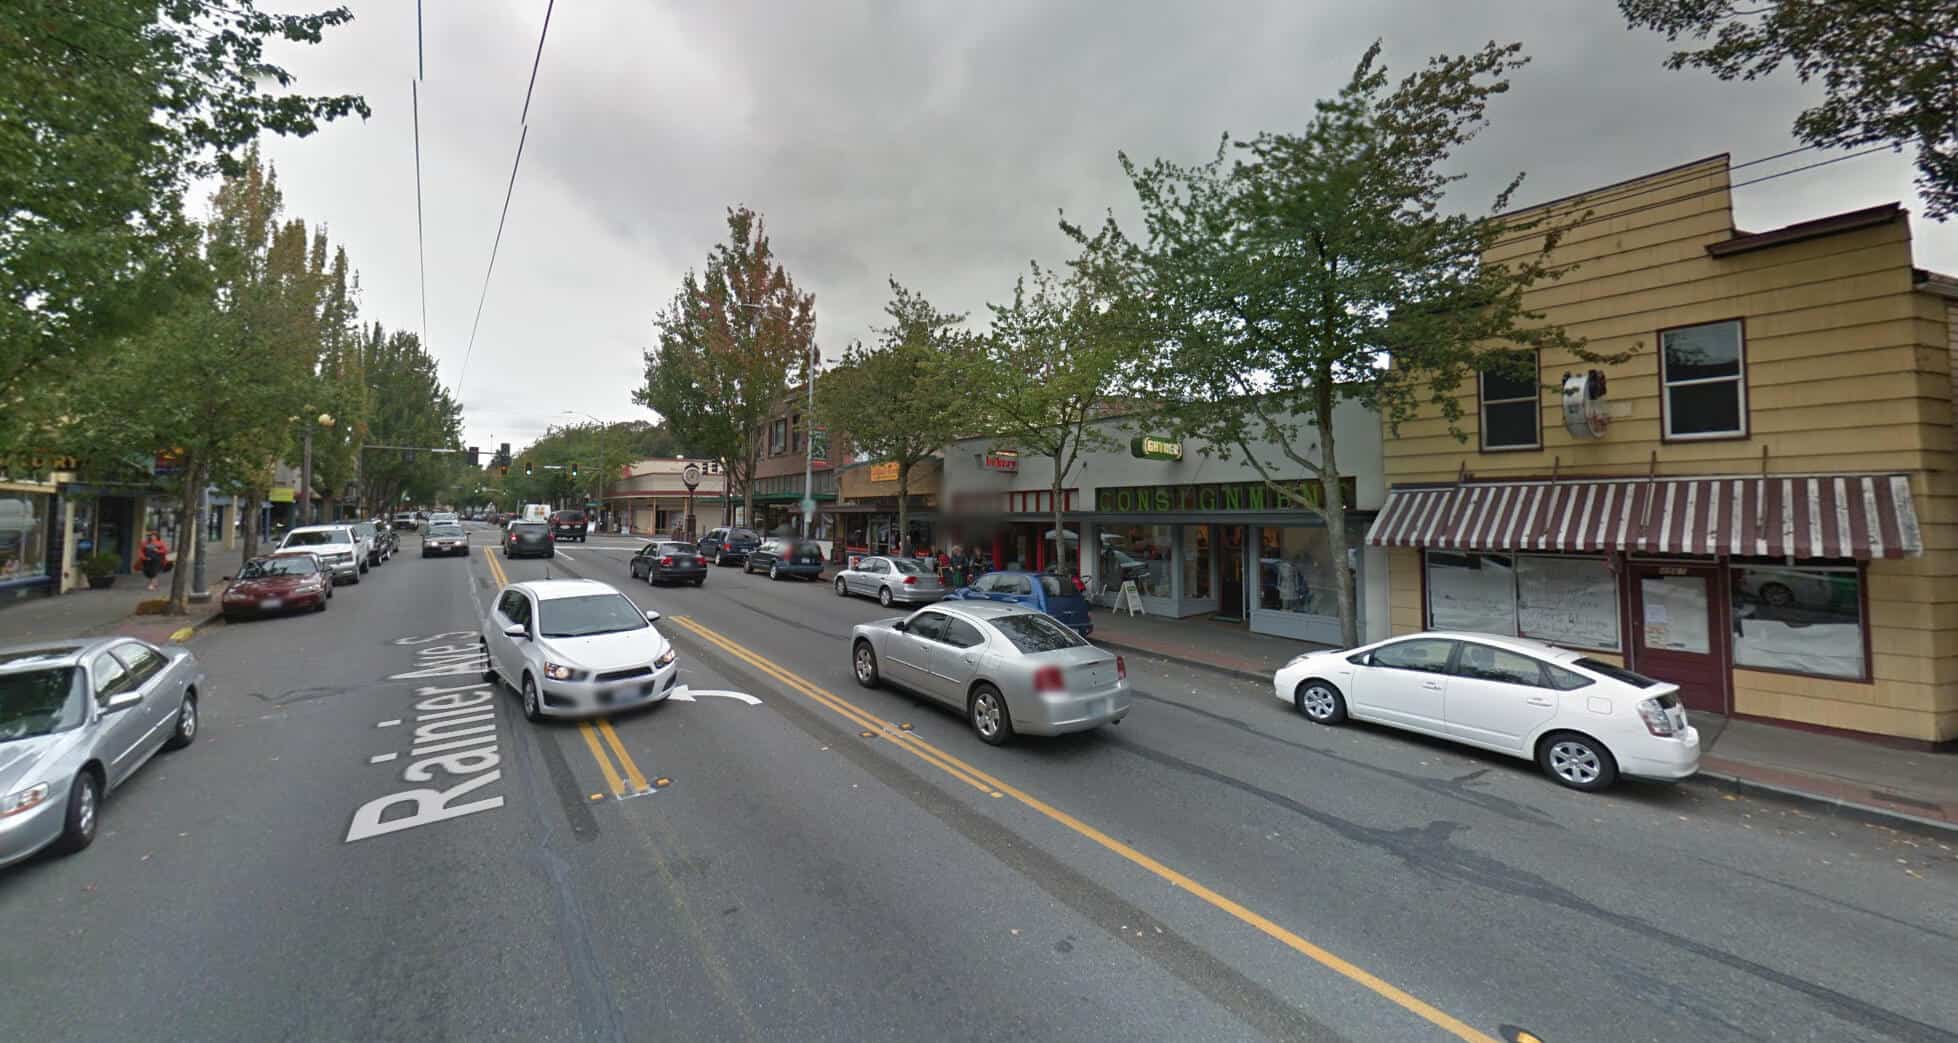
In August 2015, Seattle DOT (SDOT) restriped a one-mile section of Rainer Avenue from four travel lanes down to two travel lanes with a center turning lane (see Figure 2 below). The speed limit was also reduced from 30 miles per hour to 25 miles per hour.
The hypothesis was that the road diet would discourage drivers from speeding and passing, and thus reduce the number of accidents on the road – and it worked.
As of August 2016, collisions are down about 15%, injuries are down about 31%, and crashes involving pedestrians and bikes are down 40% (Source: King 5 News). While these statistics certainly help demonstrate the road diet’s success, we also wanted to understand how travel patterns changed after the road diet was implemented.
Figure 2: Rainier Avenue one month after the August 2015 road diet. Note that restriping has transformed the road’s four travel lanes into a new center turn lane and two travel lanes. (Source: Google Streetview)
The StreetLight InSight Analysis
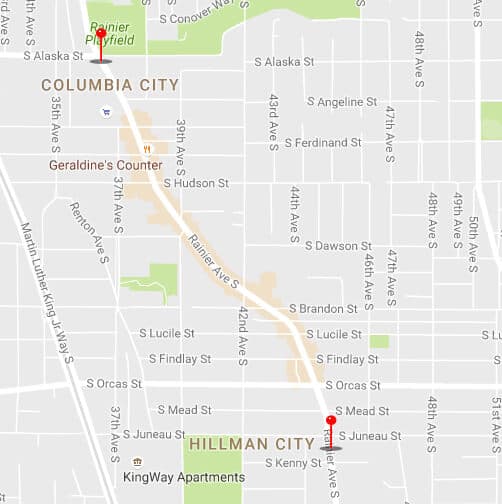
Using StreetLight InSight, we set up two corridor studies on Rainier Road where the road diet occurred (See Figure 3 below). One corridor study analyzed the period before the road diet occurred, and one corridor study analyzed the period after the road diet occurred.
First, we drew our Origin and Destination Zones: pass-through gates at the beginning and end points of the road diet (South Alaska Street and South Kenny Street). This allowed us to analyze all trips that passed through the beginning and end points of the road diet.
Figure 3: Our StreetSight InSight analysis looked at trips between S. Alaska Street and S. Kenny Street before and after the implementation of the road diet.
We ran a StreetLight InSight Origin-Destination Analysis with Premium A: Trip Attributes on trips between the O-D pairs. For both the “Before Study” (March – July 2015) and the “After Study” (November – March 2016), we zeroed in on the following Metrics:
- Average Travel Time
- Average Trip Speed
Our analysis yielded the following insights regarding personal vehicle trips:
- Average travel time increased from 162 seconds to 196 seconds
- Average speed reduced from 22.5 miles per hour to 19.5 miles per hour
Keep in mind that these statistics are the average across all types of day and times of day.
What It Means for Road Diets
The StreetLight InSight results echo the original hypothesis regarding the road diet’s impact: drivers spent about 30 extra seconds navigating the corridor at a rate about three miles slower per hour. While there may be other factors, reduced speeds and increased travel times most likely helped to reduce collisions with bikers, pedestrians, and buildings.
As a result of the safety benefits that have been realized, plans are now underway to expand the road diet further along Rainier Avenue. It’s also worth noting that, in the grand scheme of transportation infrastructure improvements, restriping projects like this are inexpensive.


