Traffic data for profitable investments
Confidently invest based on how people move
Use recent, validated traffic data to enhance models and forecasts, aiding decision-making and providing defensible insights for real estate, insurance, and infrastructure investments, such as toll roads.

Build demand forecasts with trusted transportation data
Zoom in on traffic patterns by roadway, zip code, or entire region, to build location-specific demand forecasts and models.
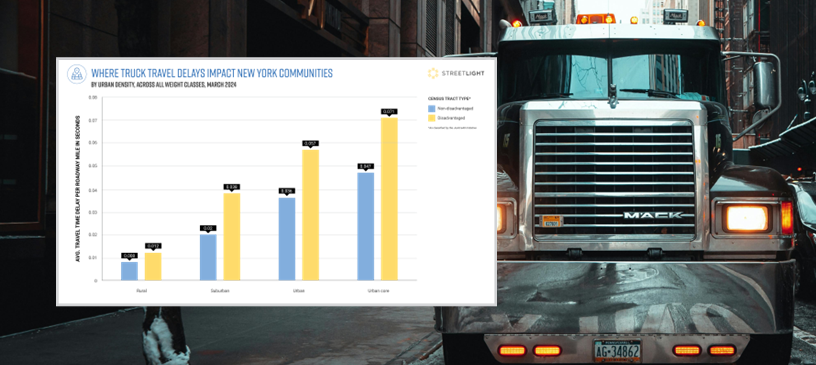
Compare vehicular and foot traffic patterns, whether in destination shopping centers or the dense urban core, and assess truck routes and stops.
Analyze current travel patterns, penetration of EVs, and trends in hydrogen fuel cells to inform future mobility trends.
Confidently deploy metrics that are the most widely used in transportation and have been consistently validated by agencies and against permanent traffic counters.
Nationwide traffic data informs profitable investments, location intelligence, and strategic operations
Get started
Measuring the impact of COVID-19 on driving to advise clients
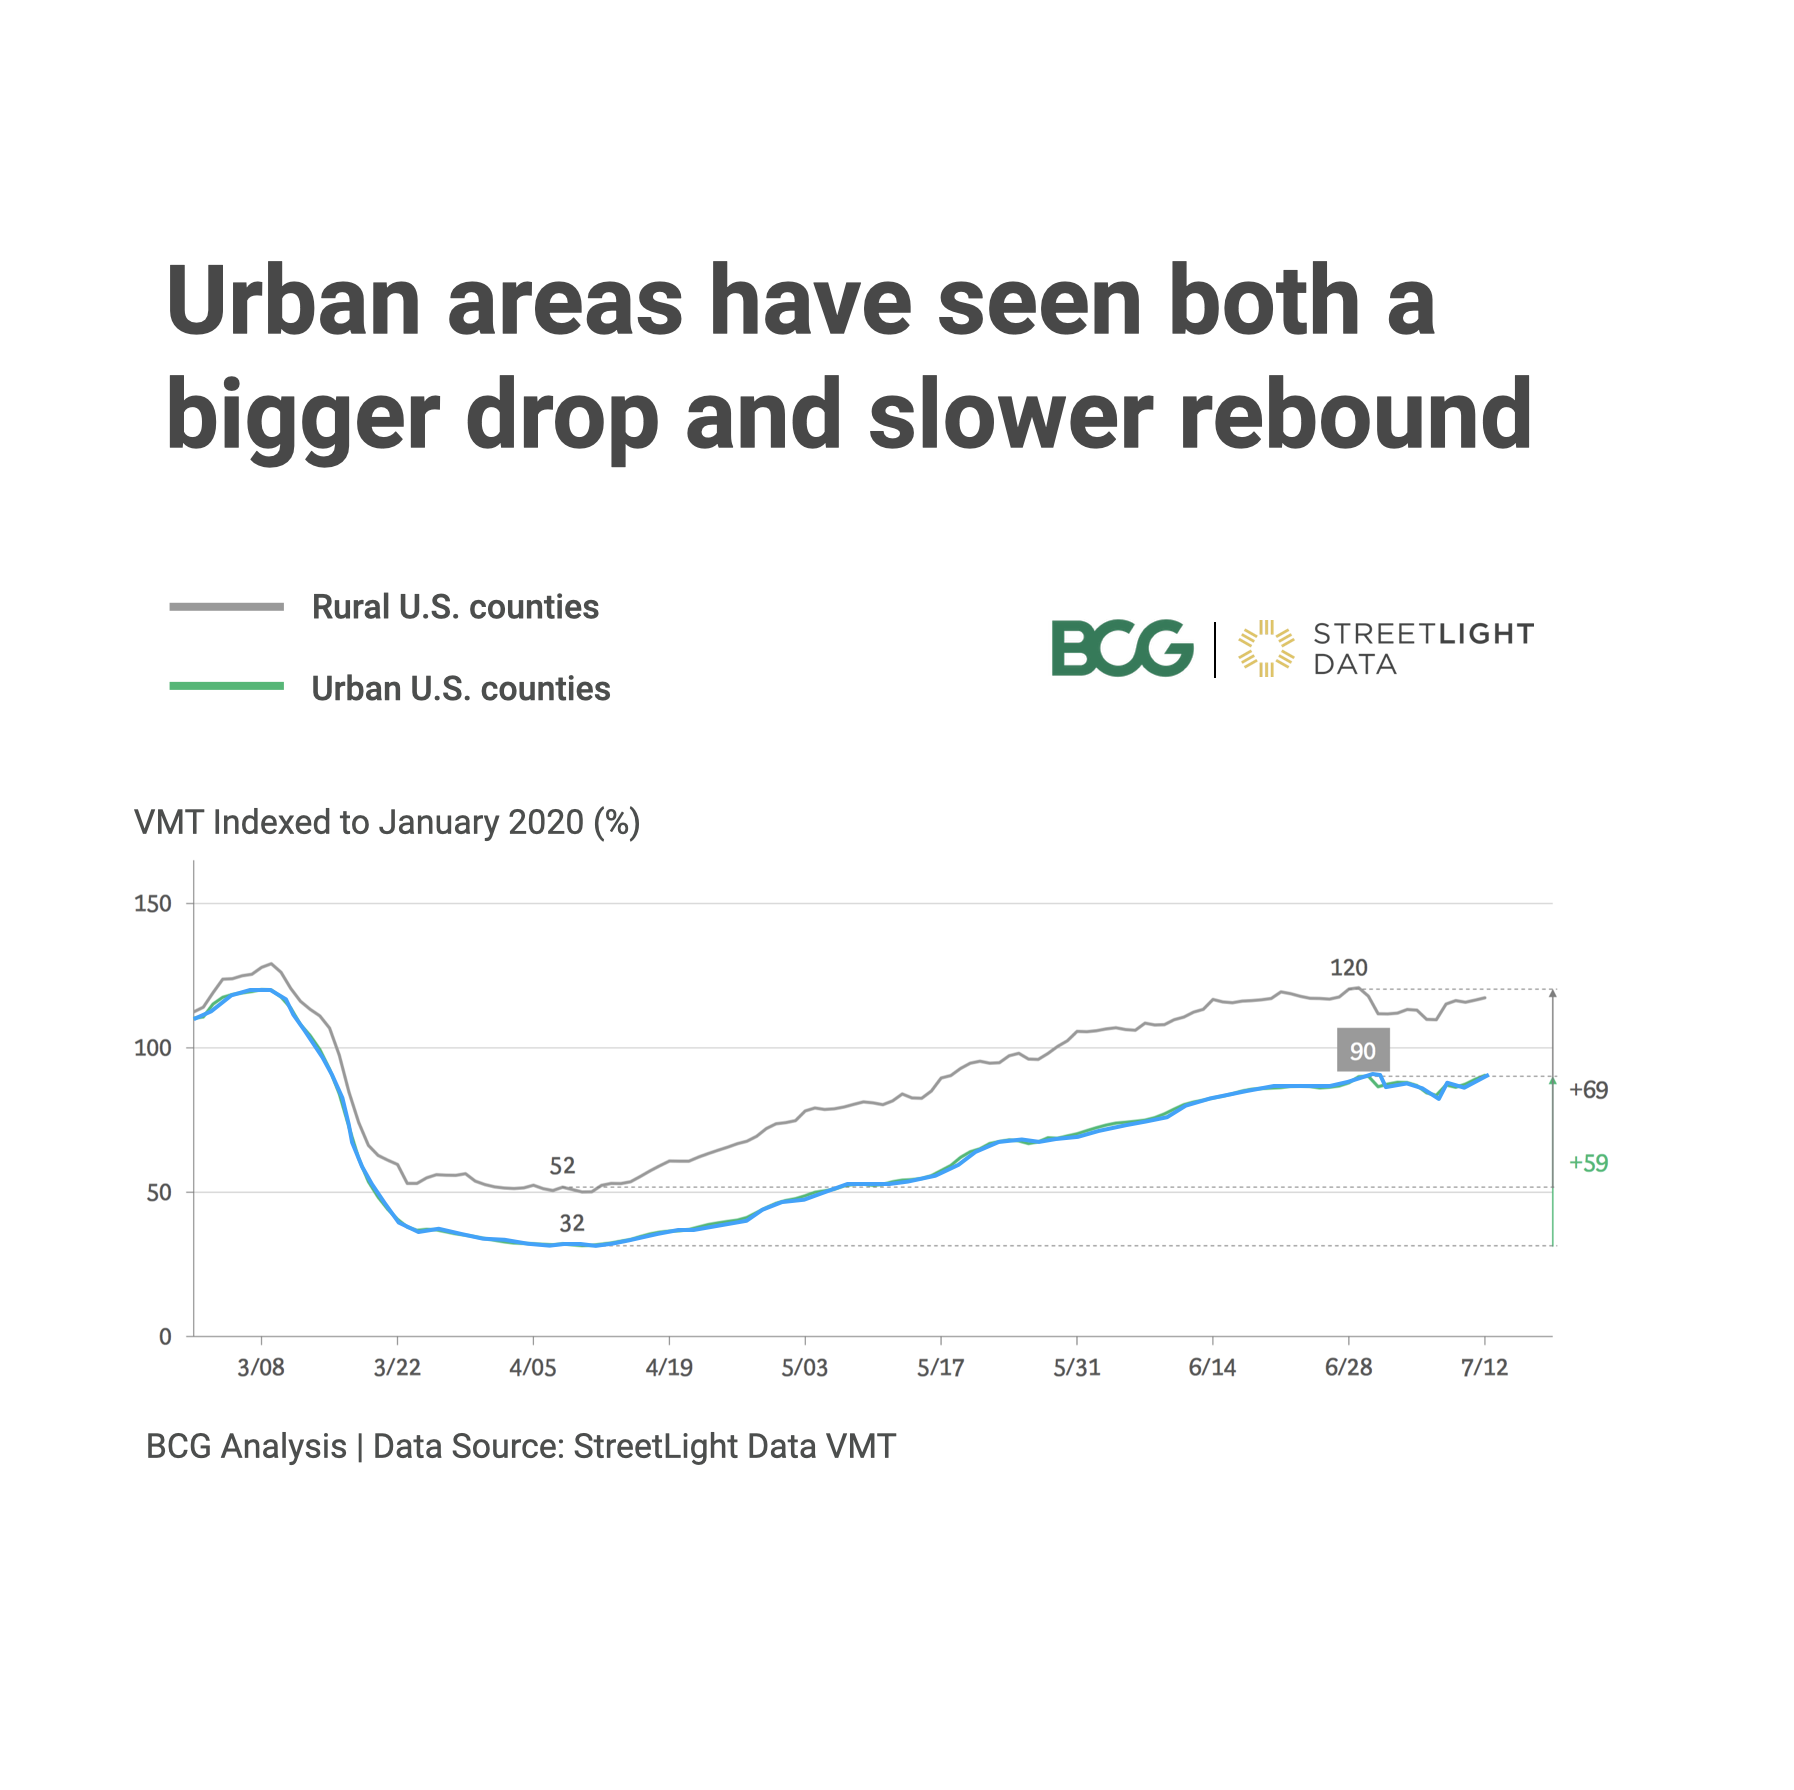
Read case studyBoston Consulting Group (BCG) analyzed the impact of stay-at-home orders on car travel behavior during the early months of the COVID-19 pandemic. They needed automotive analytics like vehicle miles traveled (VMT) data at varying geographic levels nationwide to understand how policies impacted actual car and commercial truck trips as well as to estimate how they affected tax revenues at the state level.
BCG created a “Trip Reduction Index” using StreetLight’s VMT automotive data to measure adherence to stay-at-home policies in each state, county, and MSA. They also used demographic data to determine that a key correlating factor for trip reductions was household income – likely because higher-wage workers were able to work from home. They then estimated the impact of VMT decreases on budgets, and saw that California, Florida, and Texas saw the largest daily gas tax losses.


StreetLight for Finance & Asset Management: At a Glance
Get started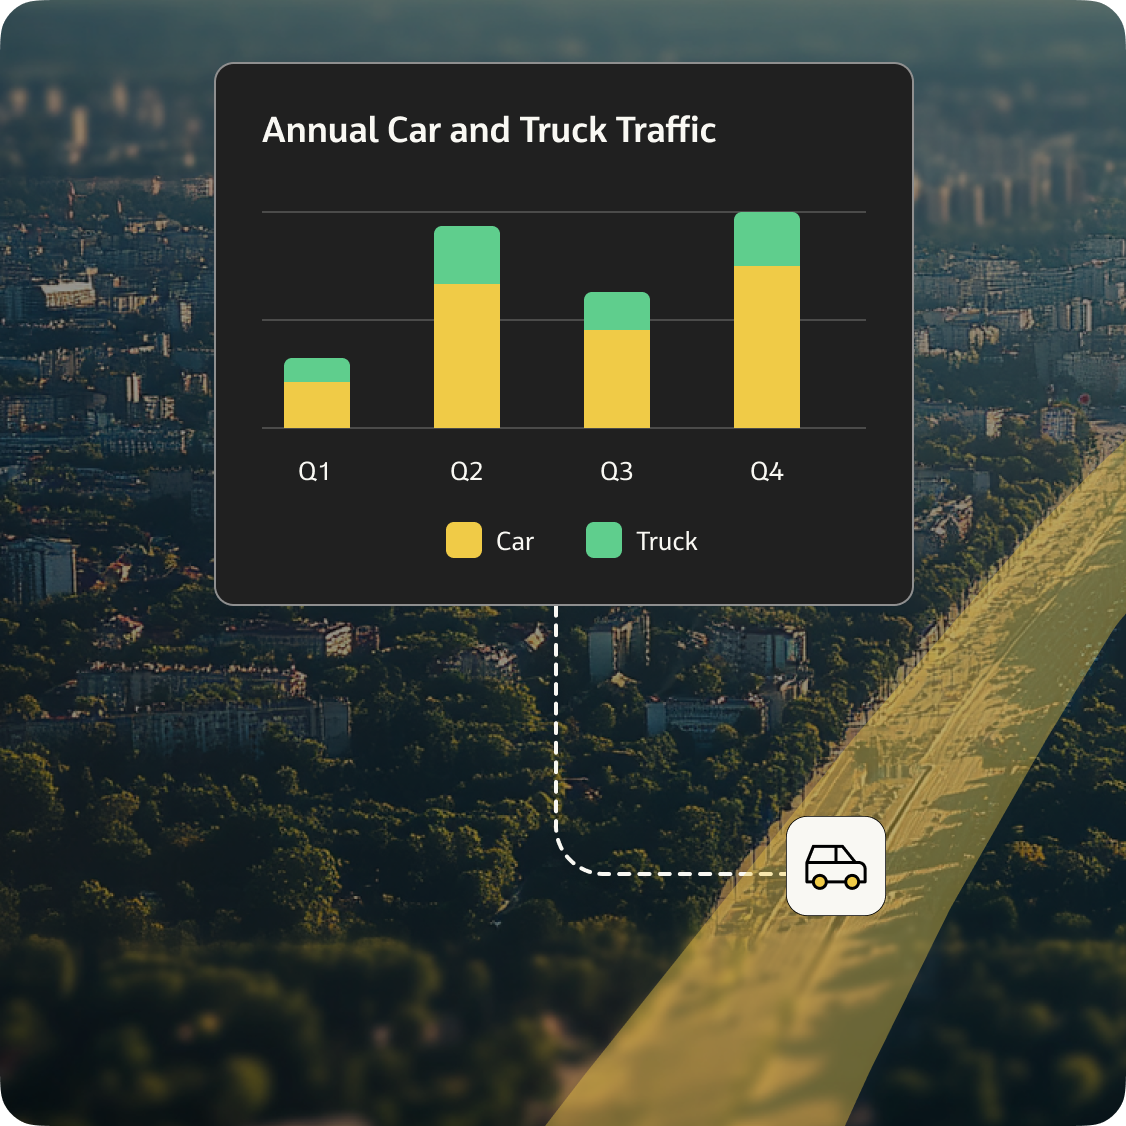


Analyze traffic counts and vehicle miles traveled (VMT) on more than 25 million road segments covering North America.

Understand how traffic moves through a corridor, or between longer-distance locations, to understand where people are coming from and going to.

Track travel patterns over time with segment-level insights for the last five years to incorporate fluctuating driving behavior.

Measure infrastructure performance based on safety, congestion, and travel time reliability comparisons to alternate roadways.

Infer more about target markets with contextual features like household income, race, family status, and why they’re traveling.

Access insights in the web platform, delivered as a bulk file, or programmatically integrated via dedicated API.


Resources
Explore our library
Case studies, data-driven research, and timely articles to learn how StreetLight helps solve future mobility challenges.
Our customers
See why they chose StreetLight

FAQs
Answers to questions you may have
Discover everything about the features and benefits of StreetLight for financial professionals.
StreetLight uses data collected from connected vehicles and the Internet of Things, which is rigorously anonymized, validated, and processed by our Route Science® engine to turn these trillions of data points into the mobility insights businesses need to make smart investments, including traffic counts, commuting patterns, turning movement counts, and more.
StreetLight processes more than 7 billion trips monthly to build detailed transportation metrics based on hundreds of data sources.
StreetLight’s data can be accessed multiple ways, making it convenient for finance and asset management companies to share insights with stakeholders and integrate data into existing systems. You can access the data via StreetLight’s self-service software platform, with purpose-built data visualizations and analytics customizations. The data can also be exported into commonly used formats like CSV and Shapefiles, or accessed via API to seamlessly integrate into your apps, dashboards, GIS platforms, and more.
StreetLight’s transportation data is rigorously validated against ground-truth data collection methods like roadway sensors to meet industry standards and ensure the most reliable insights for any location. Our metrics strongly correlate with these ground-truth methods and are trusted by industry experts. To learn more about how we process and validate our metrics, plus a list of third-party validations of our data, check out our White Papers page.
To get the most relevant and granular insights for your portfolio, you can easily access both historical and the latest month of data to analyze year-over-year or monthly trends. Temporal granularity also allows you to zoom in on any time of day, day of week, or time of year to understand typical conditions and track changes over any time period. A StreetLight rep can help you determine what data periods are currently available to help accomplish your goals.
Do you need data to inform your next project?
Talk to StreetLight about your needs, and join us in shaping a more efficient, sustainable world.
Here are some resources to help you go a step further.
