
ANALYSIS
Before and After Congestion Pricing: From Staten Island to NJ to Manhattan, How Travel Times Are Changing
Is NYC’s congestion pricing working? StreetLight analyzed travel times on ten key routes to see how traffic conditions have changed during rush hour and beyond, including areas where the tolling program faced some resistance.
On January 5, 2025, New York’s MTA launched the Congestion Relief Zone tolling program, charging drivers a fee to enter the notoriously congested streets below 60th St. in Manhattan, excluding key highways and connector roads. The new toll, which includes peak and off-peak pricing, aims to reduce area congestion, air pollution, and safety risk, while raising revenue for the MTA. The tolling effort has implications not only for congestion in the immediate tolled zone but many surrounding areas, as well. (Federal administrators recently said they were rescinding approval of the tolling program, but as of this writing the tolls remain in effect.)
The MTA released initial data from week one of congestion pricing showing improved speeds on many of the bridges and tunnels entering the zone as well as on key bus routes.1 Overall, most of the routes studied by the MTA have seen travel times improve.
StreetLight is now using its Traffic Monitor product, which helps planners and engineers monitor recent speed and congestion changes, to deepen the picture on congestion tolling with more data since the fee went into effect.
For a bird eye’s view of how traffic looked on a single day three weeks into the launch of congestion pricing, StreetLight used Traffic Monitor to create the gif below, showing the change in atypical speeds over the course of the day on January 28th, as compared to similar days in January 2024. Green, thicker lines show improved speeds while red segments indicate decreased (i.e slower) speeds.
Of course, no single day provides a perfect measurement of traffic, as any day can be affected by crashes, weather, tourist activity, construction, and other disruptions.
To further contribute to the public’s understanding, StreetLight analyzed change in travel times over a three-week study period in January on ten distinct routes in the NYC metro area. You can see the map of the routes studied below.
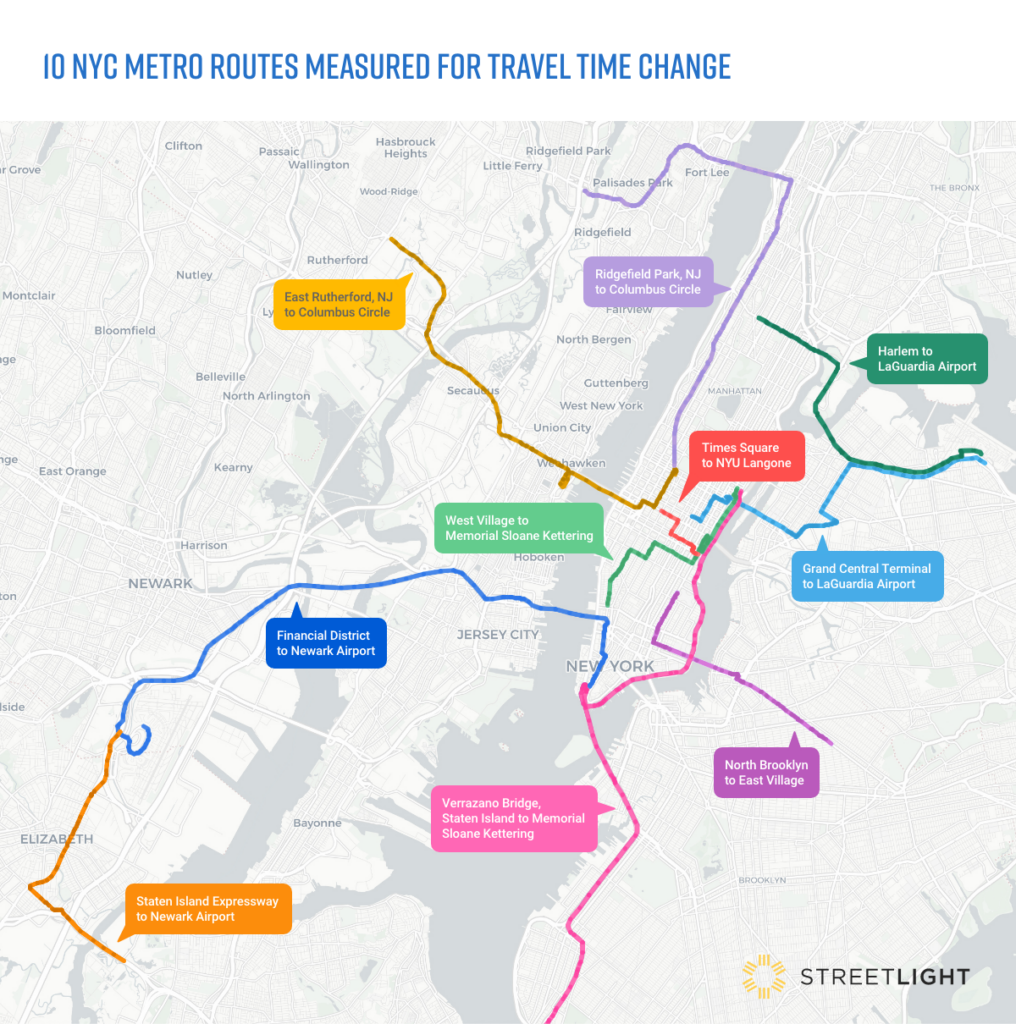
StreetLight studied north-south routes, crosstown routes, and routes traversing areas outside the toll zone, in places where some have raised concerns about increased congestion from rerouting vehicles. StreetLight also included trips ending at major hospitals, as improving emergency vehicle travel times has been a stated goal of the program.
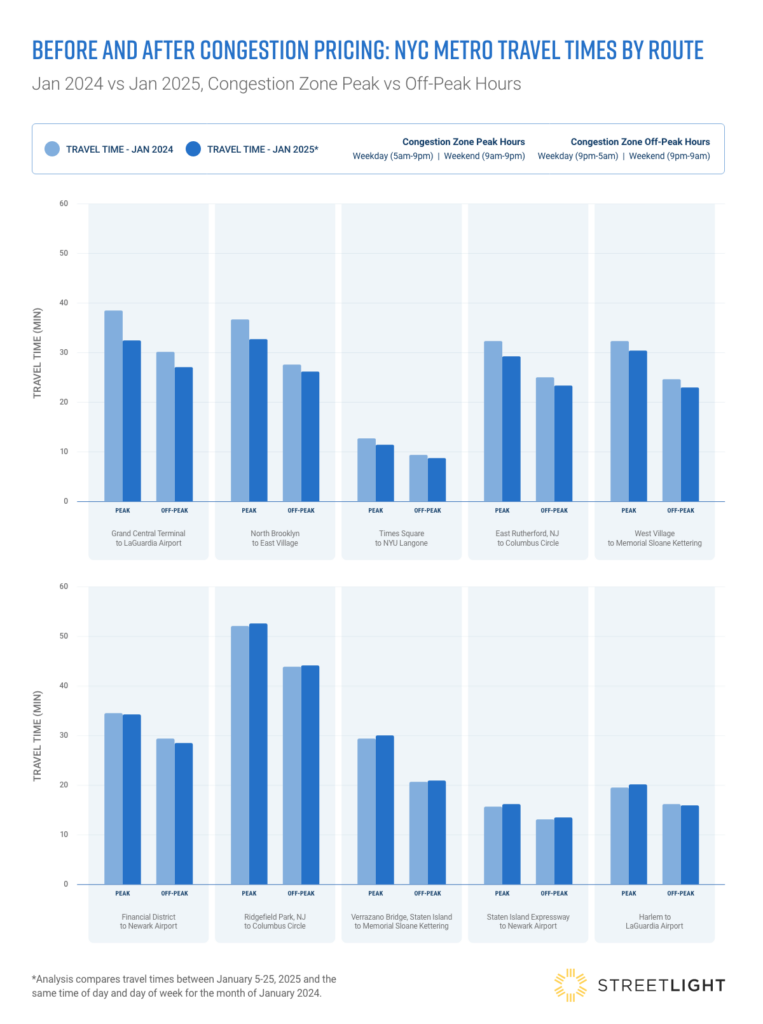
StreetLight’s analysis finds that most routes studied did see travel times improve. Six of the ten routes saw travel times decrease during both peak and off-peak tolling hours, including routes through New Jersey and Queens where there has been some resistance to congestion tolling.
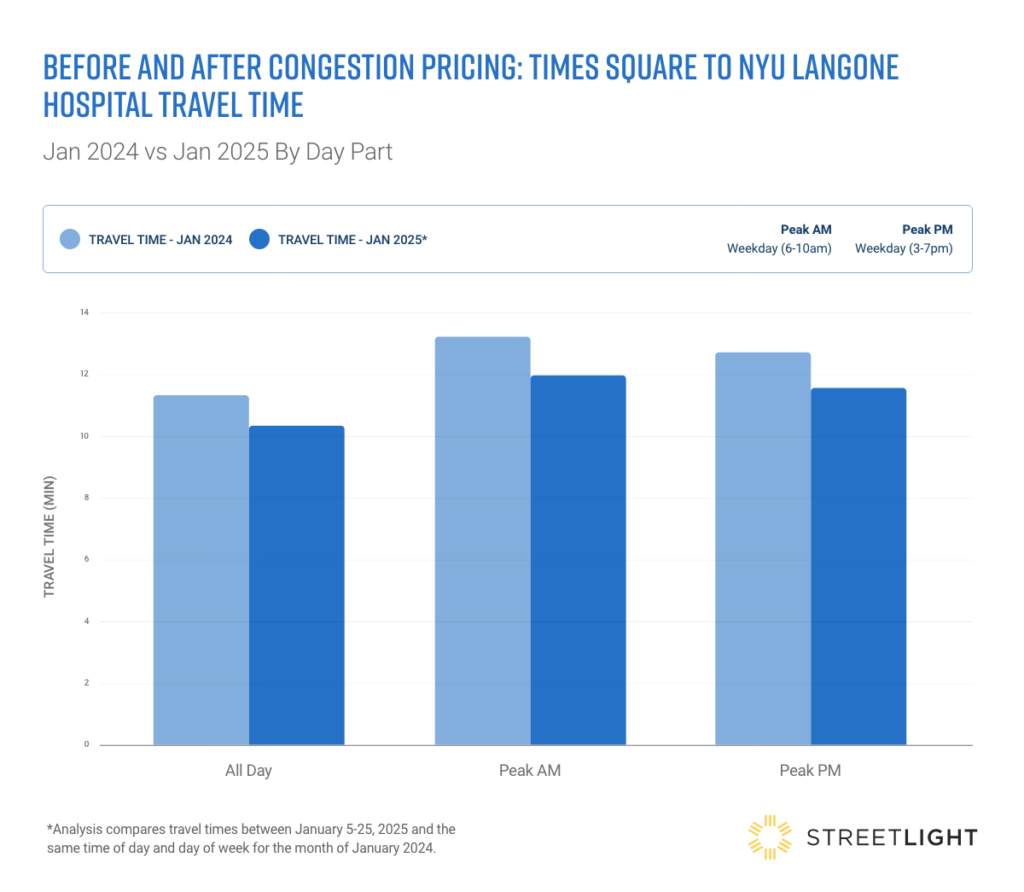
Both Manhattan-based hospital routes – from Times Square to NYU Langone and the West Village to Memorial Sloan Kettering – saw peak hour travel times decline by 10% and 6%, respectively, a positive indicator for emergency travel within the zone.
For the routes where travel times worsened, the effect was small. Even during peak hours, the increase in travel times was less than a minute on all negatively impacted routes. This may be expected regardless of policy change as vehicle miles traveled have been steadily rising since 2021.2
Routes from New Jersey to Columbus Circle saw an interesting trend. Travel over the George Washington Bridge from Ridgefield Park, NJ to the northern edge of the congestion tolling zone slowed down by a slight 30 seconds during peak hours, as compared to a year earlier. However, travel via the Lincoln Tunnel from East Rutherford, NJ to Columbus Circle improved significantly, by over 3 minutes during peak hours.
Solve congestion WITHOUT highway expansion
Get Congestion Solutions GuideAnalyzing Impact by Time of Day for Targeted Interventions
StreetLight allows planners and engineers to analyze travel at highly granular geographic and spatial scale. For example, if city planners are particularly focused on improving bottlenecks during the weekday AM or PM peak, that analysis is simple and straightforward. The impact of the MTA’s congestion charging will change over time as residents and visitors adjust, and as other trends impacting NYC arise. Many analyses will and should be done! StreetLight’s goal is to enable planners to understand and adapt to the complexities of managing congestion.
In the chart below, StreetLight compares the change in travel time on the Times Square to NYU Langone route by weekday only, looking at weekday all day vs. weekday peak AM and weekday peak PM. Peak AM travel times see the biggest improvement as compared to peak PM and all weekday.
Methodology
The analysis compares travel on select routes between January 5-25, 2025 and the same time of day and day of week for the month of January 2024. Travel times are based on sample count speed data.
Routes selected are not comprehensive of traffic in any one area. They represent travel between major destinations and aim to contribute to the picture of congestion pricing’s impact.
___
1. Metropolitan Transportation Authority (MTA). Congestion Relief Zone Tolling: Week One Update. January 13, 2025. https://www.mta.info/document/162396
2. U.S. Federal Highway Administration, Moving 12-Month Total Vehicle Miles Traveled [M12MTVUSM227NFWA], retrieved from FRED, Federal Reserve Bank of St. Louis; https://fred.stlouisfed.org/series/M12MTVUSM227NFWA, March 10, 2025.
Get traffic flowing with nine data-driven congestion solutions
Get Congestion Solutions GuideReady to dive deeper and join the conversation?
Explore the resources listed above and don’t hesitate to reach out if you have any questions. We’re committed to fostering a collaborative community of transportation professionals dedicated to building a better future for our cities and communities.