Tax Equity In An EV Future: A StreetLight Study On The Miles Driven Tax

America needs to find a sustainable way to fund its roads — and one that doesn’t overly burden drivers from disadvantaged communities.
Gas taxes are already inadequate to meet the cost of road construction, maintenance, and mass transit. Vehicle fuel efficiency and transportation project costs have risen considerably in the past few decades, while federal gas taxes have not budged since 1993. As a result, the Highway Trust Fund has experienced budget shortfalls every year since 2008.
And now, as EV infrastructure becomes more widespread, and EVs account for an increasing share of miles traveled, gas tax revenue will decrease further. While this shift will hopefully mean a welcome decrease in greenhouse gas emissions, the government will need to grapple with policy solutions to offset even lower gas tax revenues.
“The government should look for solutions that not only mitigate the gas tax shortfall but also create an equitable fee structure that doesn’t overburden drivers in disadvantaged communities.”
StreetLight looked at public data and our own metrics for VMT by county and income band in order to analyze a road usage tax in Colorado, which is considered one alternative to gas taxes, to see how it could impact people across two demographics groupings — income and geography.
Below we look at:
- The equity questions policy makers must ask
- How a VMT tax would impact drivers, by income
- How a VMT tax would impact drivers, by geography
The equity questions policy makers must ask
The Bipartisan Infrastructure Law (also known as the Infrastructure Investment and Jobs Act) includes $75 million to support feasibility studies at the state, regional, and local levels for a road usage fee. As part of their research, agencies should investigate the potential equity impacts of a road user fee change. Equity is also a central piece of the BIL.
Under a “road user fee,” AKA a “vehicle miles traveled (VMT) tax,” drivers would pay a fee based either on regular odometer readings, or by opting to install a GPS-enabled device in their vehicle to track mileage. Some states, such as Oregon and Utah, have already launched opt-in programs to pilot this approach as an alternative to gas taxes. Many more will follow as BIL funds become available for feasibility studies.
State pilot programs typically set VMT tax rates at the level needed to accrue the same amount of revenue per year as the state gas tax. Therefore, vehicles with average fuel economy tend to pay about the same per mile under a VMT tax. Vehicles with low fuel economy pay less than they would otherwise pay under a gas tax, and those with high fuel economy pay more. The degree to which a household gains or loses is proportional to how many miles they drive per year. EV owners, who currently pay nothing in gas taxes, would see the biggest changes, with increases of about $150-200 per year, based on average miles driven. Even with this new fee, however, typical EV owners would still have much lower operating costs than owners of gas-powered vehicles.
As part of their evaluation, agencies should consider the potential equity impacts of this new funding strategy:
- Who would pay more under a VMT tax?
- Who would pay less?
- How are different income groups and geographies affected?
Policymakers should investigate these dynamics to ensure that vulnerable groups would not be disproportionately impacted.
How a VMT tax would impact drivers, by income
We used data from the most recent National Household Travel Survey (NHTS) and StreetLight’s own Metrics in order to determine how a shift to VMT tax may affect drivers in Colorado. We analyzed these results by income level and geography in order to investigate whether any groups would be disproportionately affected.
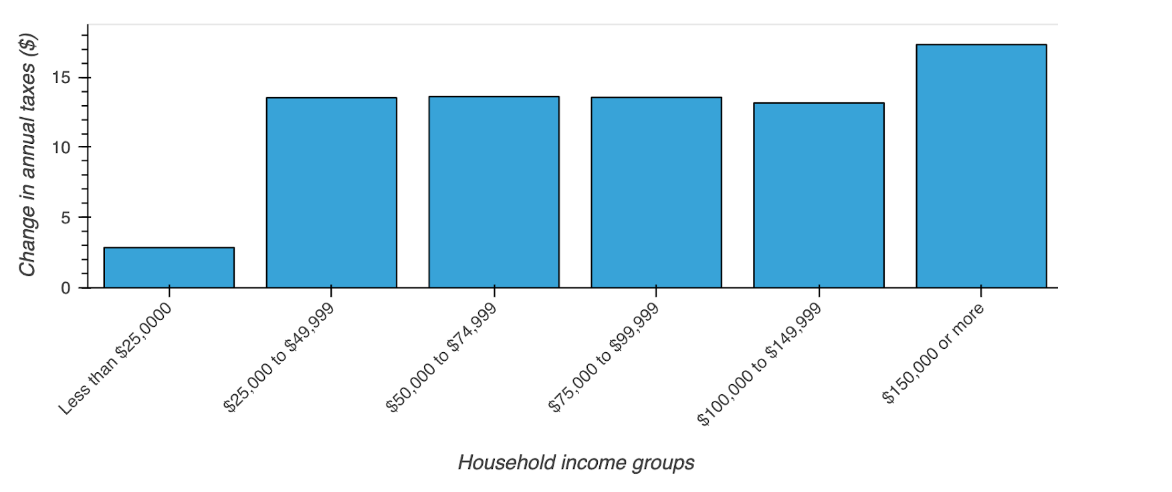
First, we calculated the amount that drivers pay under the gas tax, versus how much they would pay under a VMT tax. For costs, we used the current state gas tax for Colorado ($0.22 per gallon) and the VMT rate used in Colorado’s Road User Charge pilot program ($0.012 per mile). To turn this into household-level expenditures, we used 2017 NHTS data about individuals’ vehicle type, fuel efficiency, annual mileage1, and income. Results are shown below:

StreetLight InSight® lets you visualize your results on the flyWithin each income category, the average household would pay $3-17 more under a VMT tax than they currently do under the state gas tax. This is a relatively small increase; the state gas tax amounts to $142 on average, with half of all households paying between $127 and $208.
Lower income households would see a smaller average increase under a VMT tax, with households earning less than $25k experiencing a $2.80 average annual increase.
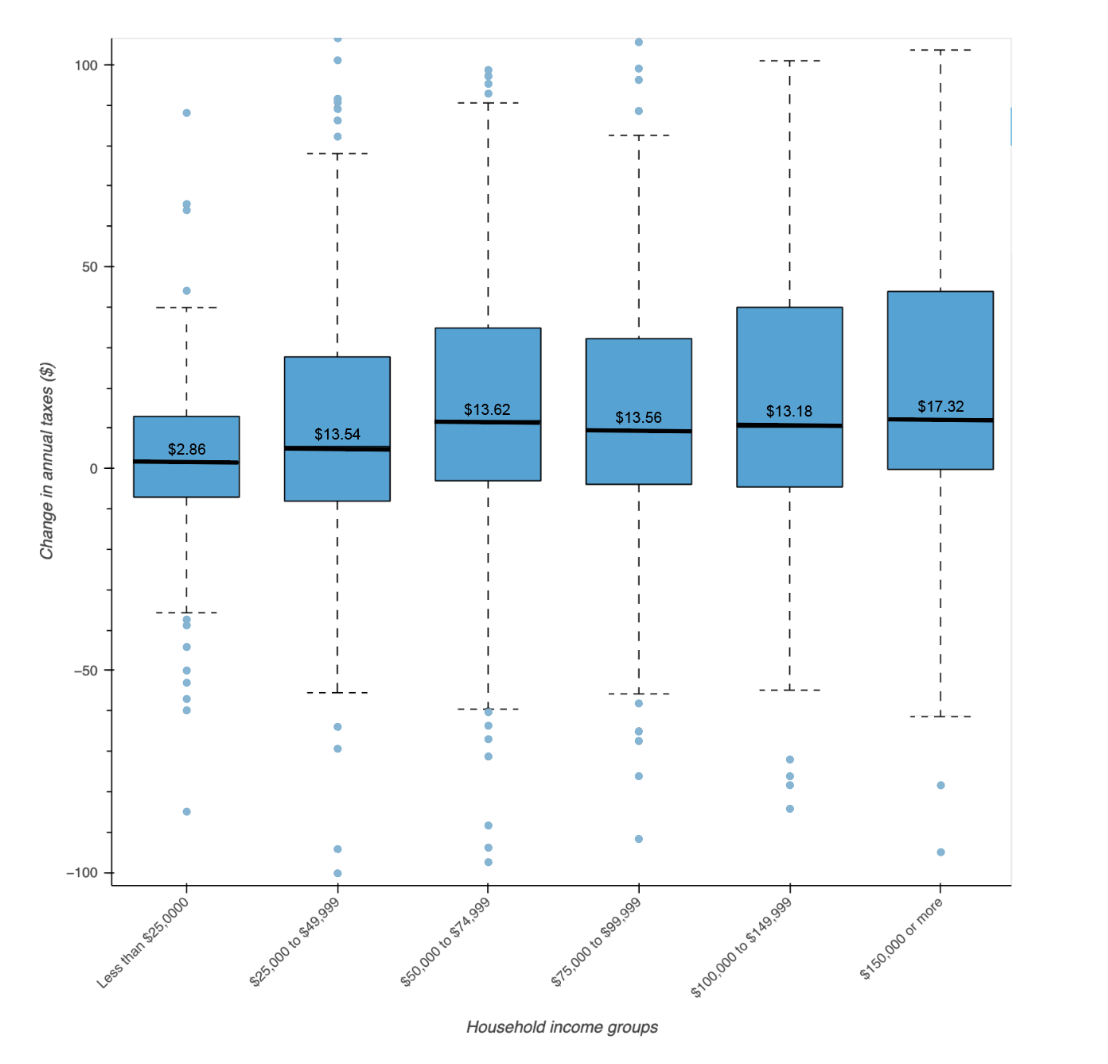
We also analyzed the variation within each income bracket, to see how households across the dataset were affected. Below is a box plot showing the change in annual costs under a VMT tax. The bold line and label shows the average change for each income bracket. The blue box is the range that contains half of the sample households. The dashed lines are where the remainder of households fall, and the blue dots are outliers2.
1 We used the “BESTMILE” statistic in NHTS. This is the best-available estimate of each household’s mileage, based on odometer readings,
 self-reported VMT, and/or travel miles on a given day.
2 There are additional outliers which exist beyond the range of the y-axis on this graph. They are not shown due to space constraints.

This figure shows that, in the lowest income band, annual expenditures for most households do not vary by more than $10 in either direction. Higher income brackets show more variation, with households paying $10 less or up to $30 more.
To understand these results, we examined fuel economy, vehicle age, and annual mileage trends for each income band. We found that households in lower income brackets tend to own older vehicles whose fuel economy is somewhat lower (~2 mpg on average) than those in other income brackets. People in these households drive lower annual distances (about 1000-1500 miles) than those in higher income bands, lowering the impact of a VMT tax.
Those in lower income brackets also showed much less variation than those in high income brackets. This suggests that people in higher income brackets may have more choice about what type of vehicle they drive, including larger trucks as well as hybrids. Those in lower brackets may have less choice, but tend to own vehicles that are not as impacted by a switch to VMT fees; some pay a little less per mile, some pay a little more, and their lower annual mileage reduces the magnitude of the impacts.
Overall, we find that the increase under a VMT tax is quite low for all income groups, and those in the lower bands do not appear disproportionately impacted. Trends in EV adoption since 2017, which show faster adoption in higher income brackets, would likely increase the difference slightly for those groups. However, EV adoption is still so low that any changes would be very small.
How a VMT tax would impact drivers, by geography
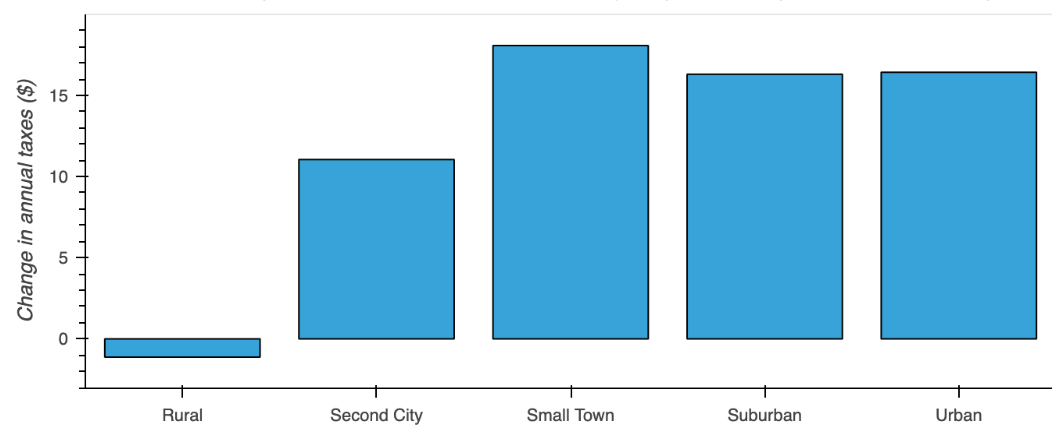
We also examined potential changes based on geography. First, we looked at home locations based on NHTS community characterizations. We found that those in rural areas would pay a few dollars less on average under a VMT tax. Those in small towns ($18/year) and more urban areas would experience larger increases, potentially due to commuting patterns. This is a somewhat unexpected finding, as it seems intuitive that rural communities drive longer distances and thus would have a higher burden. It seems a VMT tax may be offset by the gains in no longer paying a gas tax to fuel a lower efficiency vehicle.
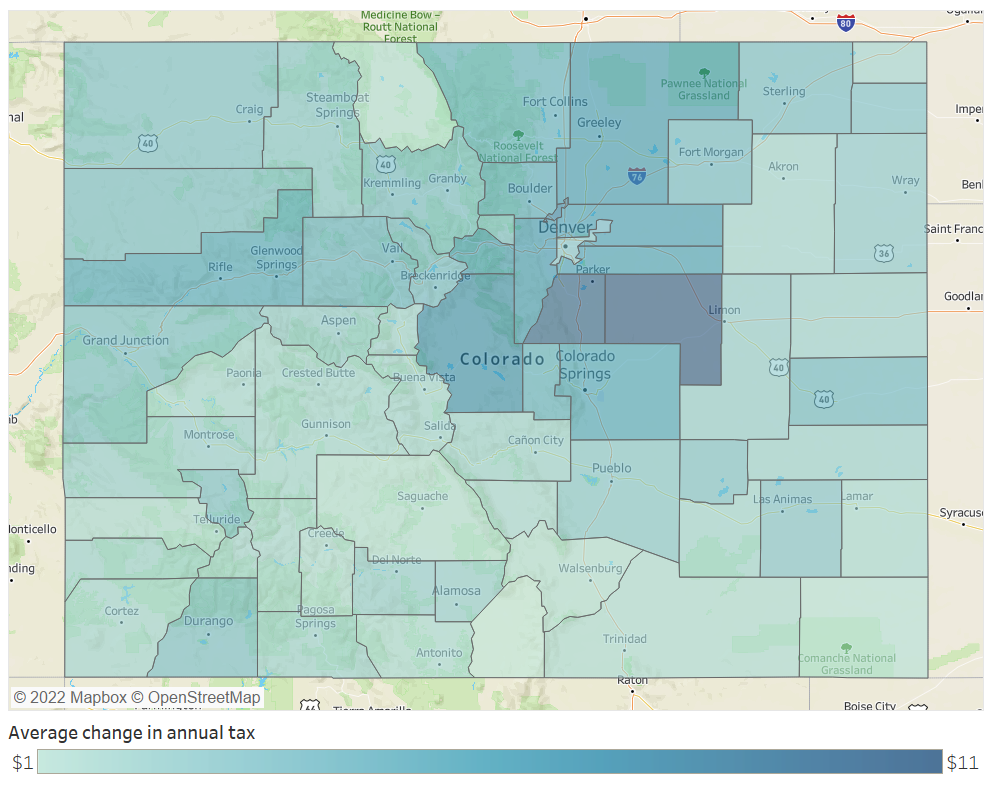
Finally, we mapped these changes to examine them visually across the state. This is where StreetLight’s data and Metrics come in. While the NHTS data provided a rich set of characteristics, the sample size isn’t large enough to extrapolate to local areas across the state. We took fuel economy distributions for each income band and applied it to Streetlight’s VMT by income band and county to estimate the overall impacts for each county in Colorado. Results are shown below.JTNDZGl2JTIwY2xhc3MlM0QlMjd0YWJsZWF1UGxhY2Vob2xkZXIlMjclMjBpZCUzRCUyN3ZpejE2NTIxMzMyMTUyNzMlMjclMjBzdHlsZSUzRCUyN3Bvc2l0aW9uJTNBJTIwcmVsYXRpdmUlMjclM0UlM0Nub3NjcmlwdCUzRSUzQ2ElMjBocmVmJTNEJTI3JTIzJTI3JTNFJTNDaW1nJTIwYWx0JTNEJTI3RGFzaGJvYXJkJTIwMSUyMCUyNyUyMHNyYyUzRCUyN2h0dHBzJTNBJTI2JTIzNDclM0IlMjYlMjM0NyUzQnB1YmxpYy50YWJsZWF1LmNvbSUyNiUyMzQ3JTNCc3RhdGljJTI2JTIzNDclM0JpbWFnZXMlMjYlMjM0NyUzQkRKJTI2JTIzNDclM0JESldaMzdGQ0slMjYlMjM0NyUzQjFfcnNzLnBuZyUyNyUyMHN0eWxlJTNEJTI3Ym9yZGVyJTNBJTIwbm9uZSUyNyUyMCUyRiUzRSUzQyUyRmElM0UlM0MlMkZub3NjcmlwdCUzRSUzQ29iamVjdCUyMGNsYXNzJTNEJTI3dGFibGVhdVZpeiUyNyUyMHN0eWxlJTNEJTI3ZGlzcGxheSUzQW5vbmUlM0IlMjclM0UlM0NwYXJhbSUyMG5hbWUlM0QlMjdob3N0X3VybCUyNyUyMHZhbHVlJTNEJTI3aHR0cHMlMjUzQSUyNTJGJTI1MkZwdWJsaWMudGFibGVhdS5jb20lMjUyRiUyNyUyMCUyRiUzRSUyMCUzQ3BhcmFtJTIwbmFtZSUzRCUyN2VtYmVkX2NvZGVfdmVyc2lvbiUyNyUyMHZhbHVlJTNEJTI3MyUyNyUyMCUyRiUzRSUyMCUzQ3BhcmFtJTIwbmFtZSUzRCUyN3BhdGglMjclMjB2YWx1ZSUzRCUyN3NoYXJlZCUyNiUyMzQ3JTNCREpXWjM3RkNLJTI3JTIwJTJGJTNFJTIwJTNDcGFyYW0lMjBuYW1lJTNEJTI3dG9vbGJhciUyNyUyMHZhbHVlJTNEJTI3eWVzJTI3JTIwJTJGJTNFJTNDcGFyYW0lMjBuYW1lJTNEJTI3c3RhdGljX2ltYWdlJTI3JTIwdmFsdWUlM0QlMjdodHRwcyUzQSUyNiUyMzQ3JTNCJTI2JTIzNDclM0JwdWJsaWMudGFibGVhdS5jb20lMjYlMjM0NyUzQnN0YXRpYyUyNiUyMzQ3JTNCaW1hZ2VzJTI2JTIzNDclM0JESiUyNiUyMzQ3JTNCREpXWjM3RkNLJTI2JTIzNDclM0IxLnBuZyUyNyUyMCUyRiUzRSUyMCUzQ3BhcmFtJTIwbmFtZSUzRCUyN2FuaW1hdGVfdHJhbnNpdGlvbiUyNyUyMHZhbHVlJTNEJTI3eWVzJTI3JTIwJTJGJTNFJTNDcGFyYW0lMjBuYW1lJTNEJTI3ZGlzcGxheV9zdGF0aWNfaW1hZ2UlMjclMjB2YWx1ZSUzRCUyN3llcyUyNyUyMCUyRiUzRSUzQ3BhcmFtJTIwbmFtZSUzRCUyN2Rpc3BsYXlfc3Bpbm5lciUyNyUyMHZhbHVlJTNEJTI3eWVzJTI3JTIwJTJGJTNFJTNDcGFyYW0lMjBuYW1lJTNEJTI3ZGlzcGxheV9vdmVybGF5JTI3JTIwdmFsdWUlM0QlMjd5ZXMlMjclMjAlMkYlM0UlM0NwYXJhbSUyMG5hbWUlM0QlMjdkaXNwbGF5X2NvdW50JTI3JTIwdmFsdWUlM0QlMjd5ZXMlMjclMjAlMkYlM0UlM0NwYXJhbSUyMG5hbWUlM0QlMjdsYW5ndWFnZSUyNyUyMHZhbHVlJTNEJTI3ZW4tVVMlMjclMjAlMkYlM0UlM0NwYXJhbSUyMG5hbWUlM0QlMjdmaWx0ZXIlMjclMjB2YWx1ZSUzRCUyN3B1Ymxpc2glM0R5ZXMlMjclMjAlMkYlM0UlM0MlMkZvYmplY3QlM0UlM0MlMkZkaXYlM0UlMjAlM0NzY3JpcHQlMjB0eXBlJTNEJTI3dGV4dCUyRmphdmFzY3JpcHQlMjclM0UlMjB2YXIlMjBkaXZFbGVtZW50JTIwJTNEJTIwZG9jdW1lbnQuZ2V0RWxlbWVudEJ5SWQlMjglMjd2aXoxNjUyMTMzMjE1MjczJTI3JTI5JTNCJTIwdmFyJTIwdml6RWxlbWVudCUyMCUzRCUyMGRpdkVsZW1lbnQuZ2V0RWxlbWVudHNCeVRhZ05hbWUlMjglMjdvYmplY3QlMjclMjklNUIwJTVEJTNCJTIwaWYlMjAlMjglMjBkaXZFbGVtZW50Lm9mZnNldFdpZHRoJTIwJTNFJTIwODAwJTIwJTI5JTIwJTdCJUUyJTgwJThCJTIwdml6RWxlbWVudC5zdHlsZS53aWR0aCUzRCUyNzEwMDBweCUyNyUzQnZpekVsZW1lbnQuc3R5bGUuaGVpZ2h0JTNEJTI3ODI3cHglMjclM0IlN0QlMjBlbHNlJTIwaWYlMjAlMjglMjBkaXZFbGVtZW50Lm9mZnNldFdpZHRoJTIwJTNFJTIwNTAwJTIwJTI5JTIwJTdCJUUyJTgwJThCJTIwdml6RWxlbWVudC5zdHlsZS53aWR0aCUzRCUyNzEwMDBweCUyNyUzQnZpekVsZW1lbnQuc3R5bGUuaGVpZ2h0JTNEJTI3ODI3cHglMjclM0IlN0QlMjBlbHNlJTIwJTdCJUUyJTgwJThCJTIwdml6RWxlbWVudC5zdHlsZS53aWR0aCUzRCUyNzEwMCUyNSUyNyUzQnZpekVsZW1lbnQuc3R5bGUuaGVpZ2h0JTNEJTI3NzI3cHglMjclM0IlN0QlMjB2YXIlMjBzY3JpcHRFbGVtZW50JTIwJTNEJTIwZG9jdW1lbnQuY3JlYXRlRWxlbWVudCUyOCUyN3NjcmlwdCUyNyUyOSUzQiUyMHNjcmlwdEVsZW1lbnQuc3JjJTIwJTNEJTIwJTI3aHR0cHMlM0ElMkYlMkZwdWJsaWMudGFibGVhdS5jb20lMkZqYXZhc2NyaXB0cyUyRmFwaSUyRnZpel92MS5qcyUyNyUzQiUyMHZpekVsZW1lbnQucGFyZW50Tm9kZS5pbnNlcnRCZWZvcmUlMjhzY3JpcHRFbGVtZW50JTJDJTIwdml6RWxlbWVudCUyOSUzQiUyMCUzQyUyRnNjcmlwdCUzRQ==

Again, we see slight increases in annual taxes across all areas, ranging from $1 to $11. The most urban (Denver) and most rural counties are some of the least affected, with average drivers paying only $1-4 more under a VMT tax. The more affected areas are between Denver and Colorado Springs, in counties with relatively high average annual mileage. These may be areas with higher numbers of long-distance commuters who own relatively fuel-efficient vehicles.

Grant applicants have used StreetLight for everything from highlighting commuting metrics to show a project’s economic value to using bike and pedestrian metrics to give the full mobility picture to origin-destination analysis to show regional benefit.
In Ohio, for example, the state DOT embarked on a project to revamp Interstates 70 and 71, which would improve corridors of the National Primary Highway Freight System and help reconnect communities adversely affected by redlining and the construction of those interstates.
To fund Phase 4 of the development, Ohio DOT applied for a federal Infrastructure for Rebuilding America (INFRA) grant and used StreetLight to make their case.
Using the platform, planners separated out passenger vehicles from commercial truck volume, proving the significant percentage of traffic on the corridor from freight movement. They used StreetLight’s visualization tools to show truck congestion in the existing corridor and make the case for how a new truck route would ease the national supply chain.
Findings
Overall, we found that a VMT tax in Colorado would cause a slight increase in annual expenditures for all income brackets, but that those in the lowest income bracket saw a smaller increase with less variation across households. Those in higher income brackets tend to own a wider range of vehicle types that are more efficient on average, and they drove longer distances. This leads to a higher average increase per year, with some households more affected than others due to vehicle choice and driving patterns.
Geographically, we found that those in rural areas would save a few dollars per year, and that those in more urban areas would pay about $15-18 more. When we extrapolated out findings to all counties in the state, we did not see strong trends or differences across counties. Again, every area saw a slight increase, with the biggest increase ($11) occurring in counties likely to contain long-distance commuters.
Our findings suggest that very low-income populations and rural counties would not be disproportionately impacted by a shift from gas taxes to mileage-based user fees.