COVID-19 Puts Bike-Sharing in the Fast Lane

Last week, Bloomberg’s primary research organization New Energy Finance released a 15-page report, analyzing global demand for bike sharing services as impacted by COVID-19 and spurred by the lockdowns in April and May.
Relying on data from public agencies, StreetLight’s bicycle and vehicular metrics and providers like New York’s Citi Bike, the report evaluates several observations about bike ridership and transit use in communities big and small.
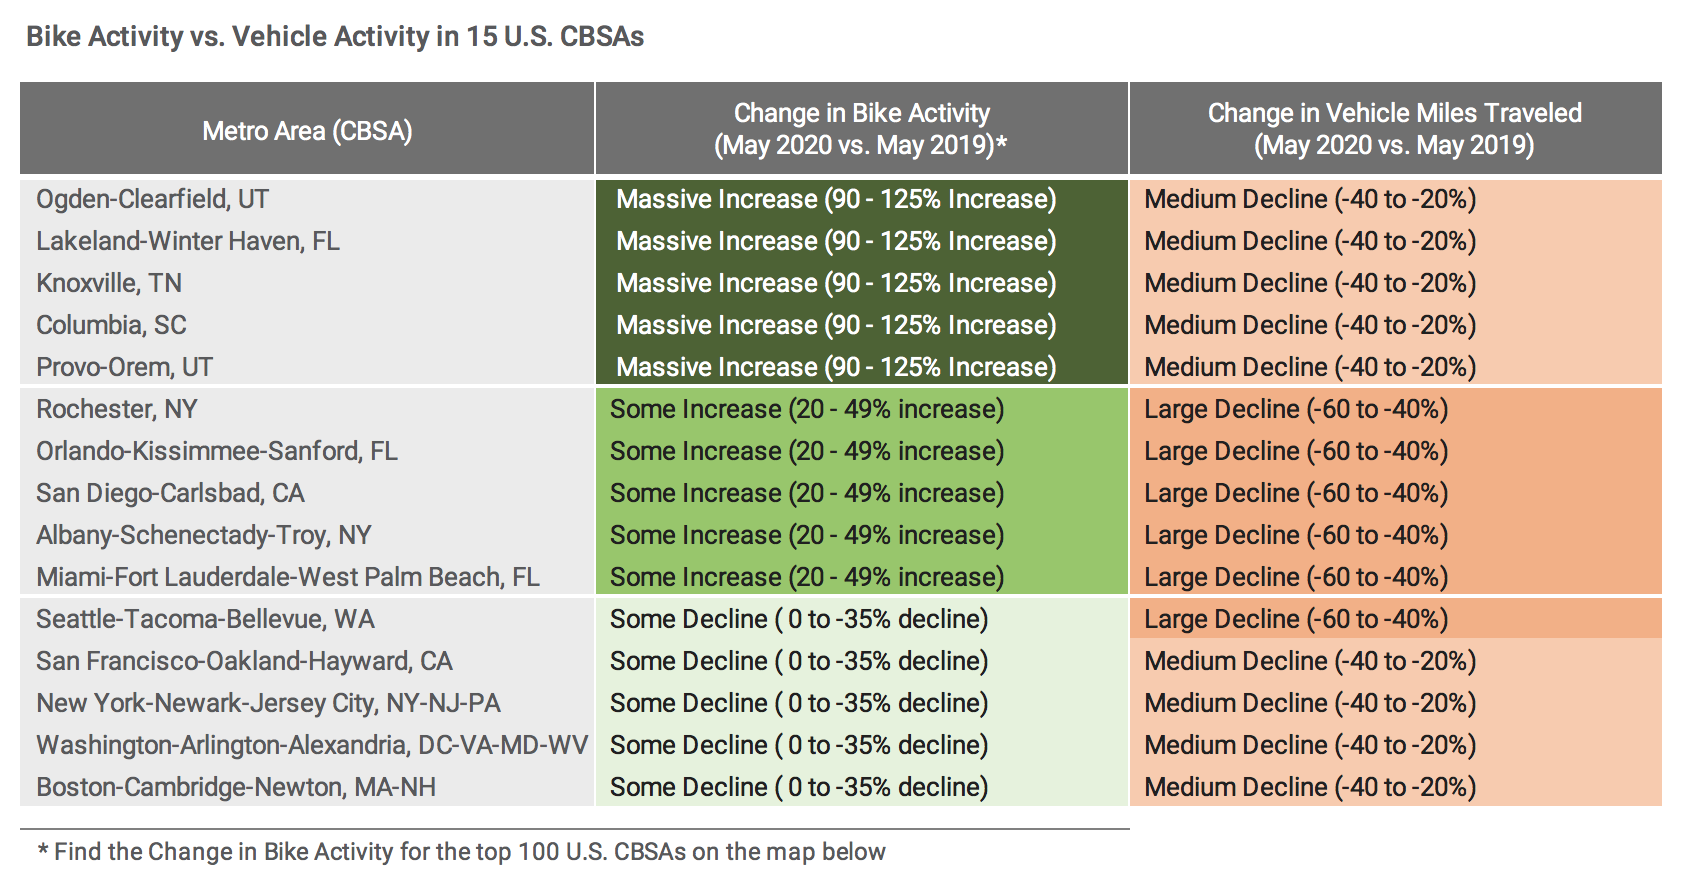
According to the report, smaller U.S. metro areas with shorter commutes and low public transit ridership experienced some of the biggest increases in bike ridership. The below table highlights five such areas analyzed by StreetLight which saw approx. a doubling of bike activity in May 2020 vs May 2019. Also notable are five metros in New York, Florida and California that were heavily impacted by pandemic-driven stay-at-home orders, experiencing 40 to 60% declines in year-over-year VMT in May, while seeing 20 to 50% increases in year-over-year bike ridership.
Finally, at least 5 large metros impacted by COVID-19 saw flat-to-declining bike activity in the same period, driven by a reduction in total commuting, regardless of mode. BloombergNEF points out, based on data from New York City’s Citi Bike program, that New York saw YOY decreases in Citi Bike ridership during weekdays and increases during the weekends.
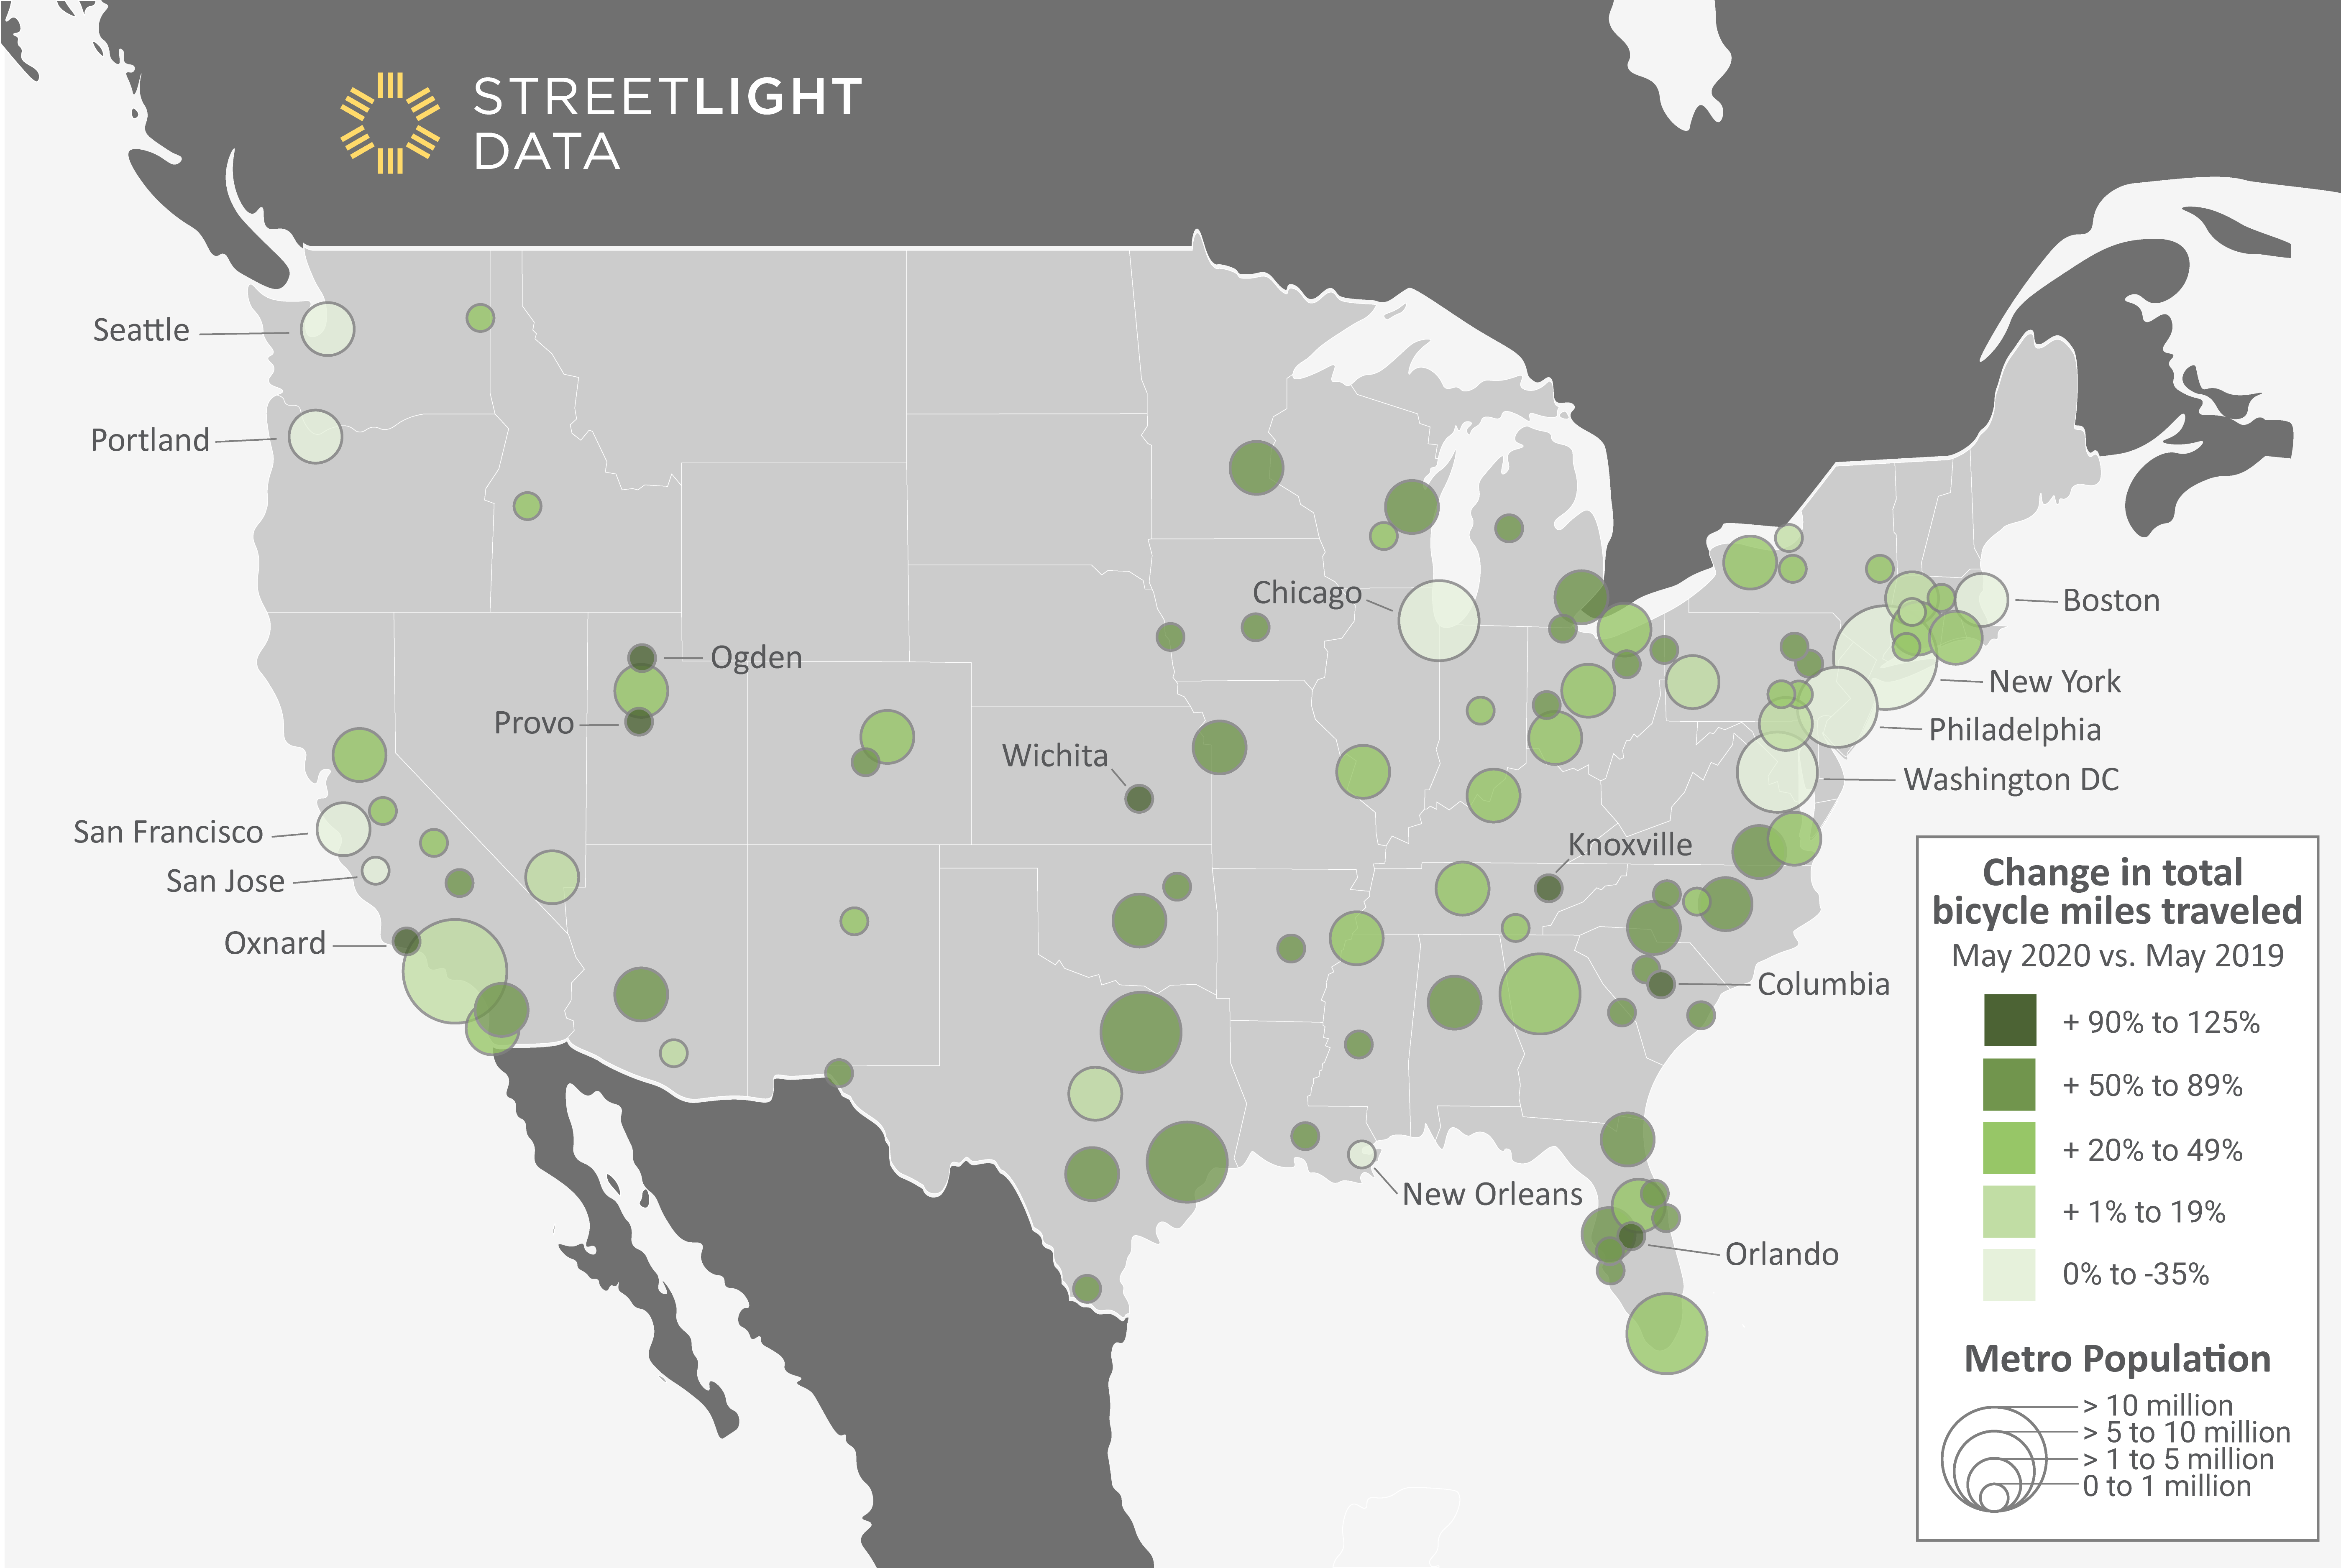
Review below a map summarizing StreetLight’s analysis of the year-of-year change in bike ridership in May 2020 for the top 100 U.S. metros.

