6 Types of Transportation Big Data Every City Needs
In a changing transportation landscape, it’s more important than ever for planners to have access to detailed data and analytics. Given our increasingly complex transportation networks, planners must consider where to implement road diets, add EV charging infrastructure, establish tollways, expand access to multimodal transport, and so much more.
While traditional methods of data collection and analysis (think: surveys and sensors) can still offer important insights, today’s cities often seek the help of something bigger — Big Data. In transportation, Big Data involves large, complex data sets collected from numerous sources to provide a complete picture of today’s transportation networks, including various modes of transportation and how they interact. This type of detailed data is collected from trillions of pings from connected vehicles and the Internet of Things, combined with contextual data like the census and maps of the roadway network, which is anonymized, aggregated, and processed by machine learning engines to generate recognizable metrics like Annual Average Daily Traffic (AADT) and Vehicle Miles Traveled (VMT), which transportation planners use every day.
Having access to detailed real-time and historical transportation data empowers planners and transportation departments to develop better strategies, reduce costs, prioritize initiatives, and measure the effectiveness of each change or improvement. But which metrics are most important for smart planning and development? To make a wide range of informed decisions, planners typically rely on the following Big Data for transportation, which we’ll cover in this article:
- Annual Average Daily Traffic
- Origin-Destination
- Turning Movement Counts
- Vehicle Miles Traveled
- Vehicles Hours of Delay
- Vehicle Speeds
1. Annual Average Daily Traffic
Annual Average Daily Traffic (AADT) is perhaps the most foundational metric in transportation analytics. It measures the average daily volume of traffic on a given road during a given year, and it’s critical for evaluating road congestion, spotting safety concerns, and planning infrastructure updates. AADT also plays an integral role in shaping non-transportation decisions, such as developing new retail or investigating accident cases.

Historically, this fundamental piece of traffic data has been expensive and time-consuming to acquire. Traditional collection methods for AADT require working counters that can track traffic counts 24 hours a day, 365 days a year. In many jurisdictions, it’s simply not possible to collect this much data for every road.
Today, however, machine learning allows software like StreetLight InSight® to build models that calculate AADT for more roadways — and much more quickly. Instead of spending time and money installing sensors on every roadway or extrapolating annual numbers from a few days’ worth of manual counts, Big Data leverages large sample sizes and a continuous stream of data to quickly deliver the most reliable, up-to-date data on roadway volumes.
Test-drive StreetLight's AADT metrics
Get a Free Trial2. Origin-Destination
Origin-Destination (O-D) patterns provide another essential piece of the puzzle in transportation data analytics. O-D data helps transportation professionals understand where trips begin and end, shedding light on commute patterns, areas of high travel demand, and locations that generate the most traffic. For these reasons, O-D data is often used by agencies to understand where infrastructure improvements, policy changes, or traffic management strategies can help optimize traffic flow, encourage mode shift to walking, biking, and transit, boost economic activity, and more.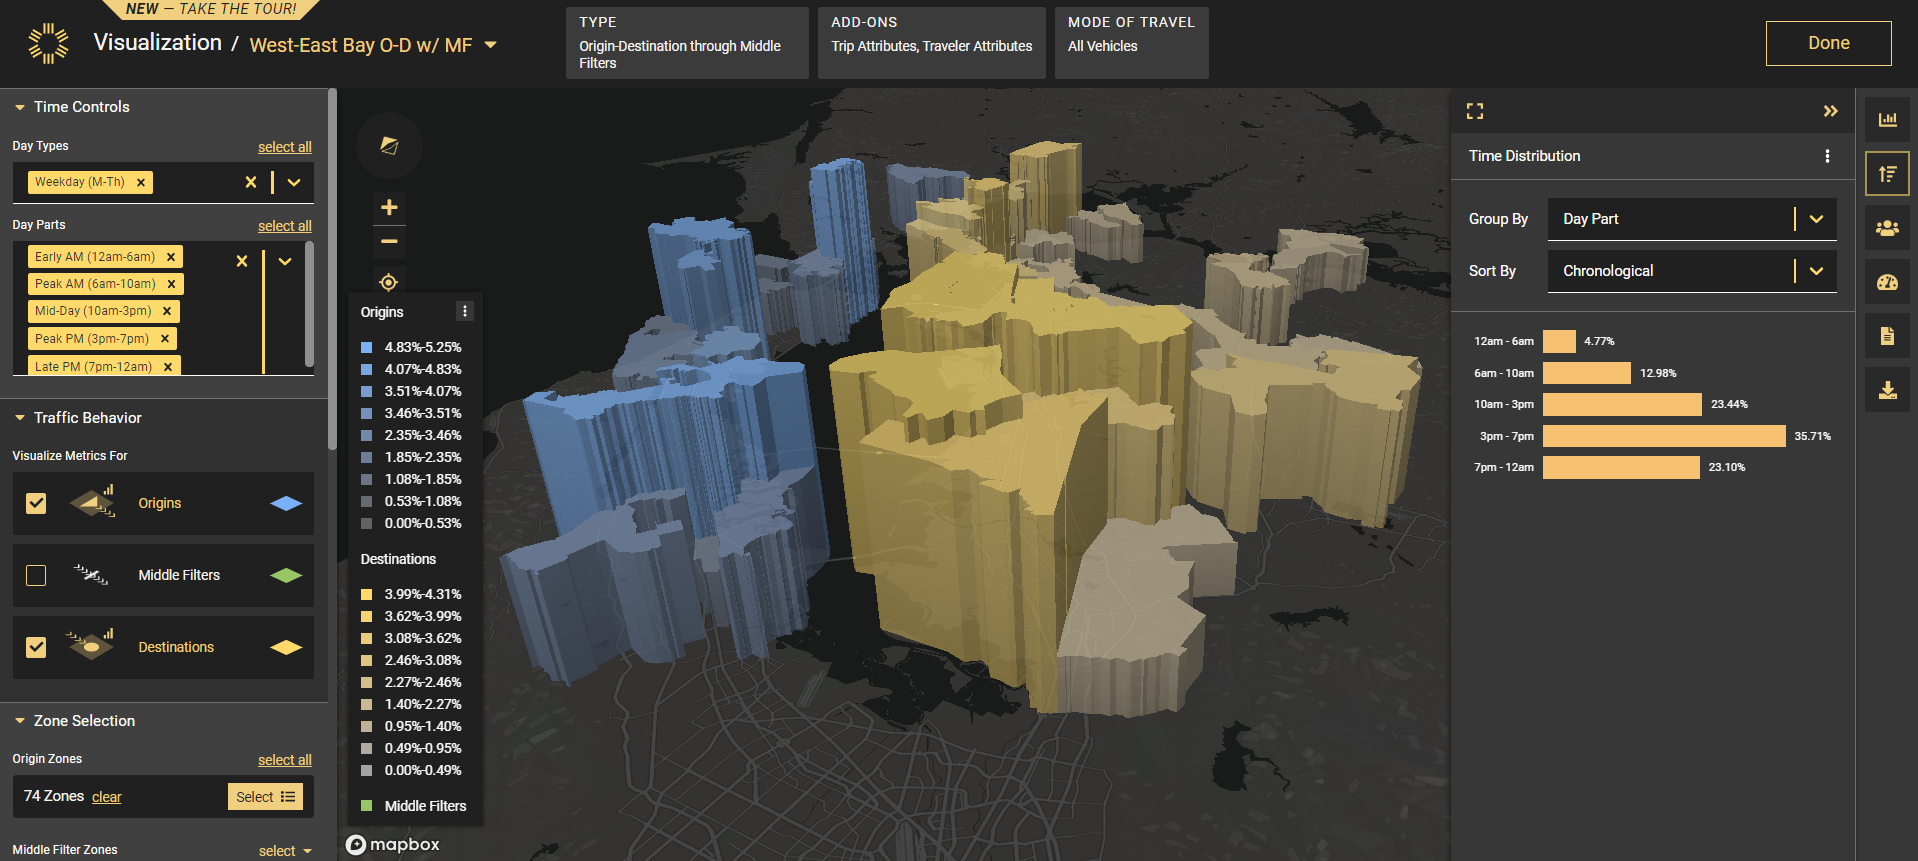
An Origin-Destination analysis in StreetLight InSight® shows top origins and destinations, with a time distribution overlay contextualizing when most trips occur.
However, traditional O-D metrics are often incomplete and inefficient to collect, requiring extensive surveys which are typically costly and suffer from human bias and small sample size issues. Big Data can provide more detailed information — without the survey process — and go beyond typical O-D analyses to identify the most prevalent travel routes and allow planners to easily customize their analysis and contextualize O-D patterns with other data overlays like vehicle speeds or AADT.
For instance, planners in Sarasota, Florida, used StreetLight O-D data to prioritize bike routes and route directness and create a stronger multimodal network. Using detailed metrics without the need for surveys, Sarasota connected more bike and pedestrian routes to transit services and key destinations to reduce congestion and create a more equitable transportation system.
3. Turning Movement Counts
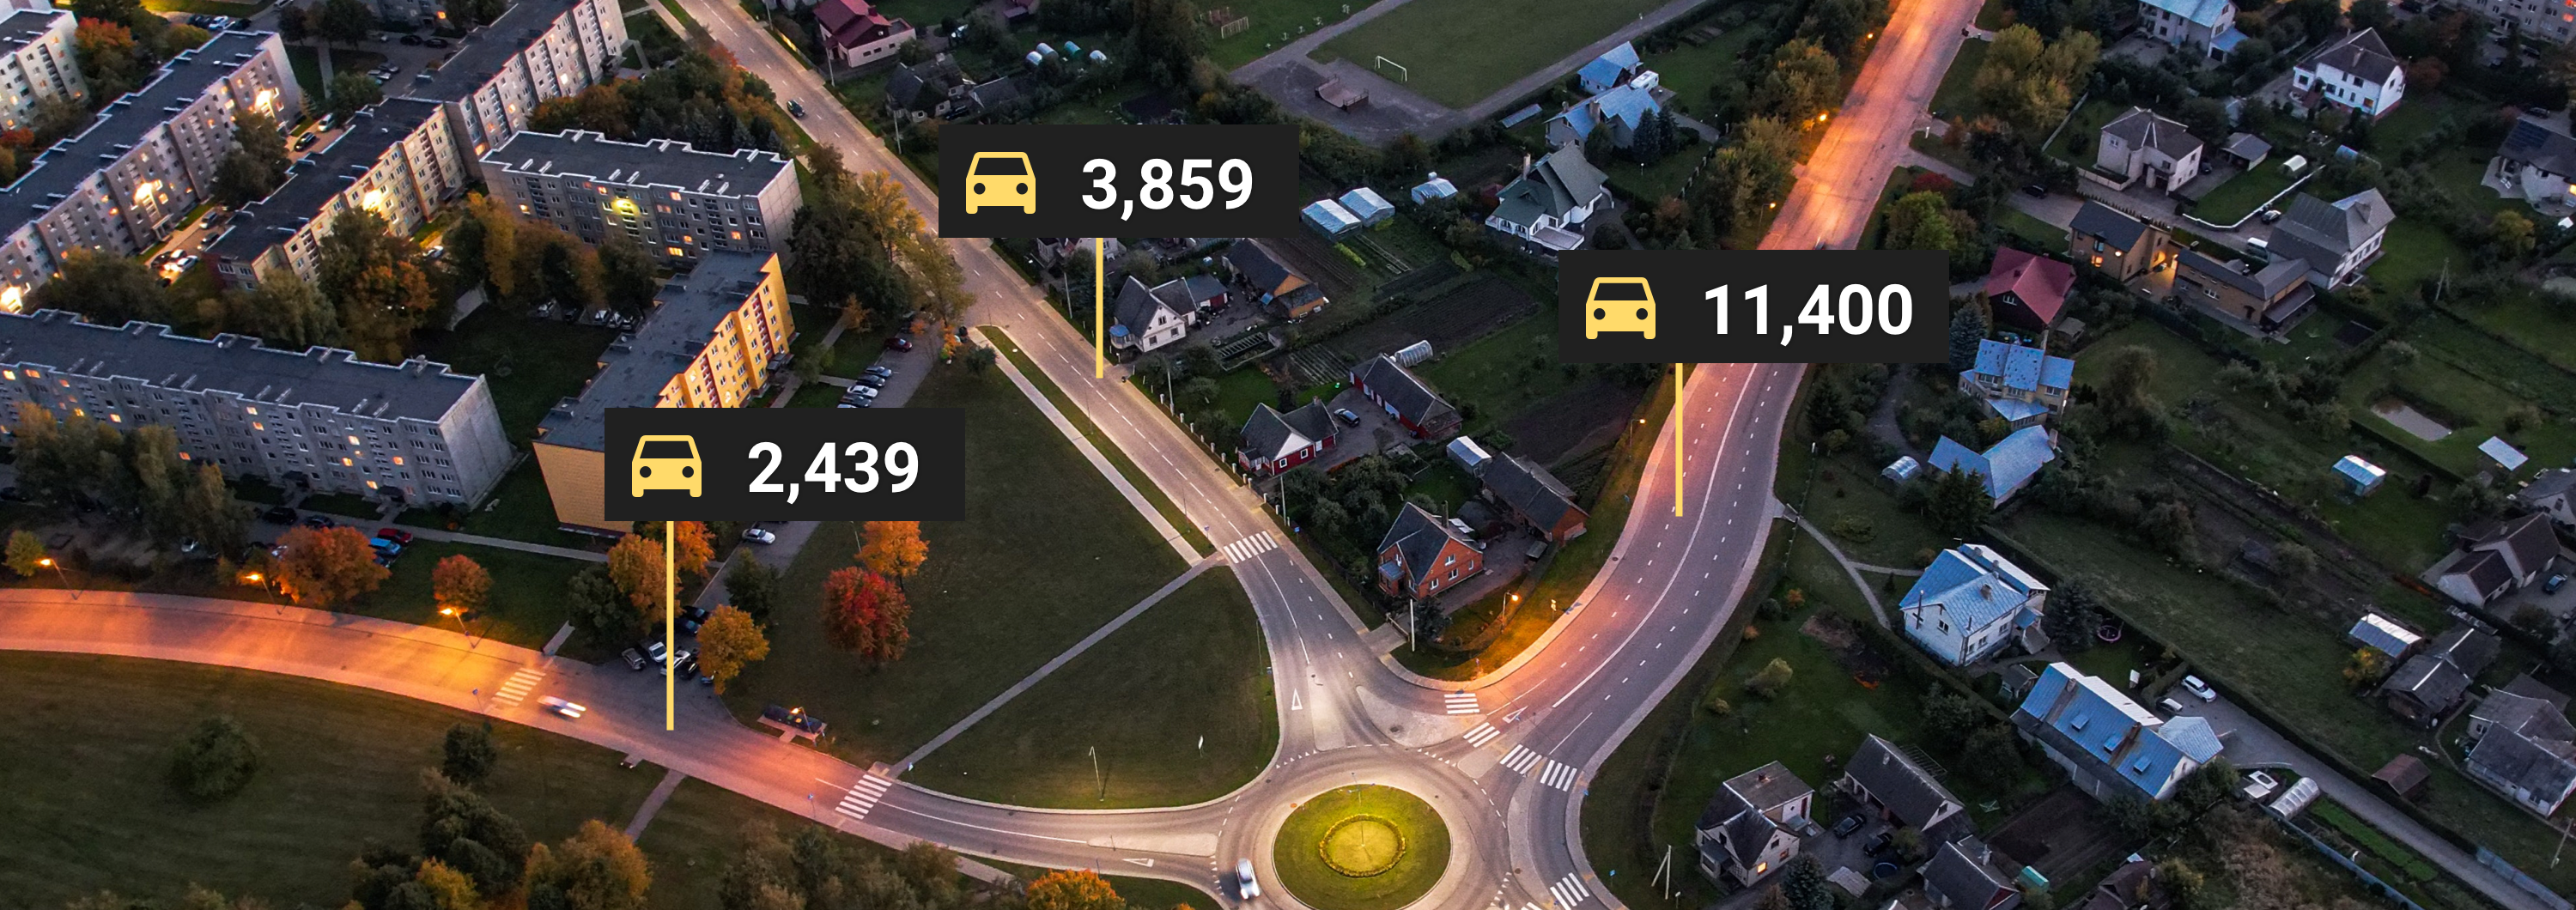
Turning Movement Counts (TMC) provide critical safety and congestion information about intersections. In simple terms, they demonstrate the volume of traffic entering and exiting an intersection at a given time.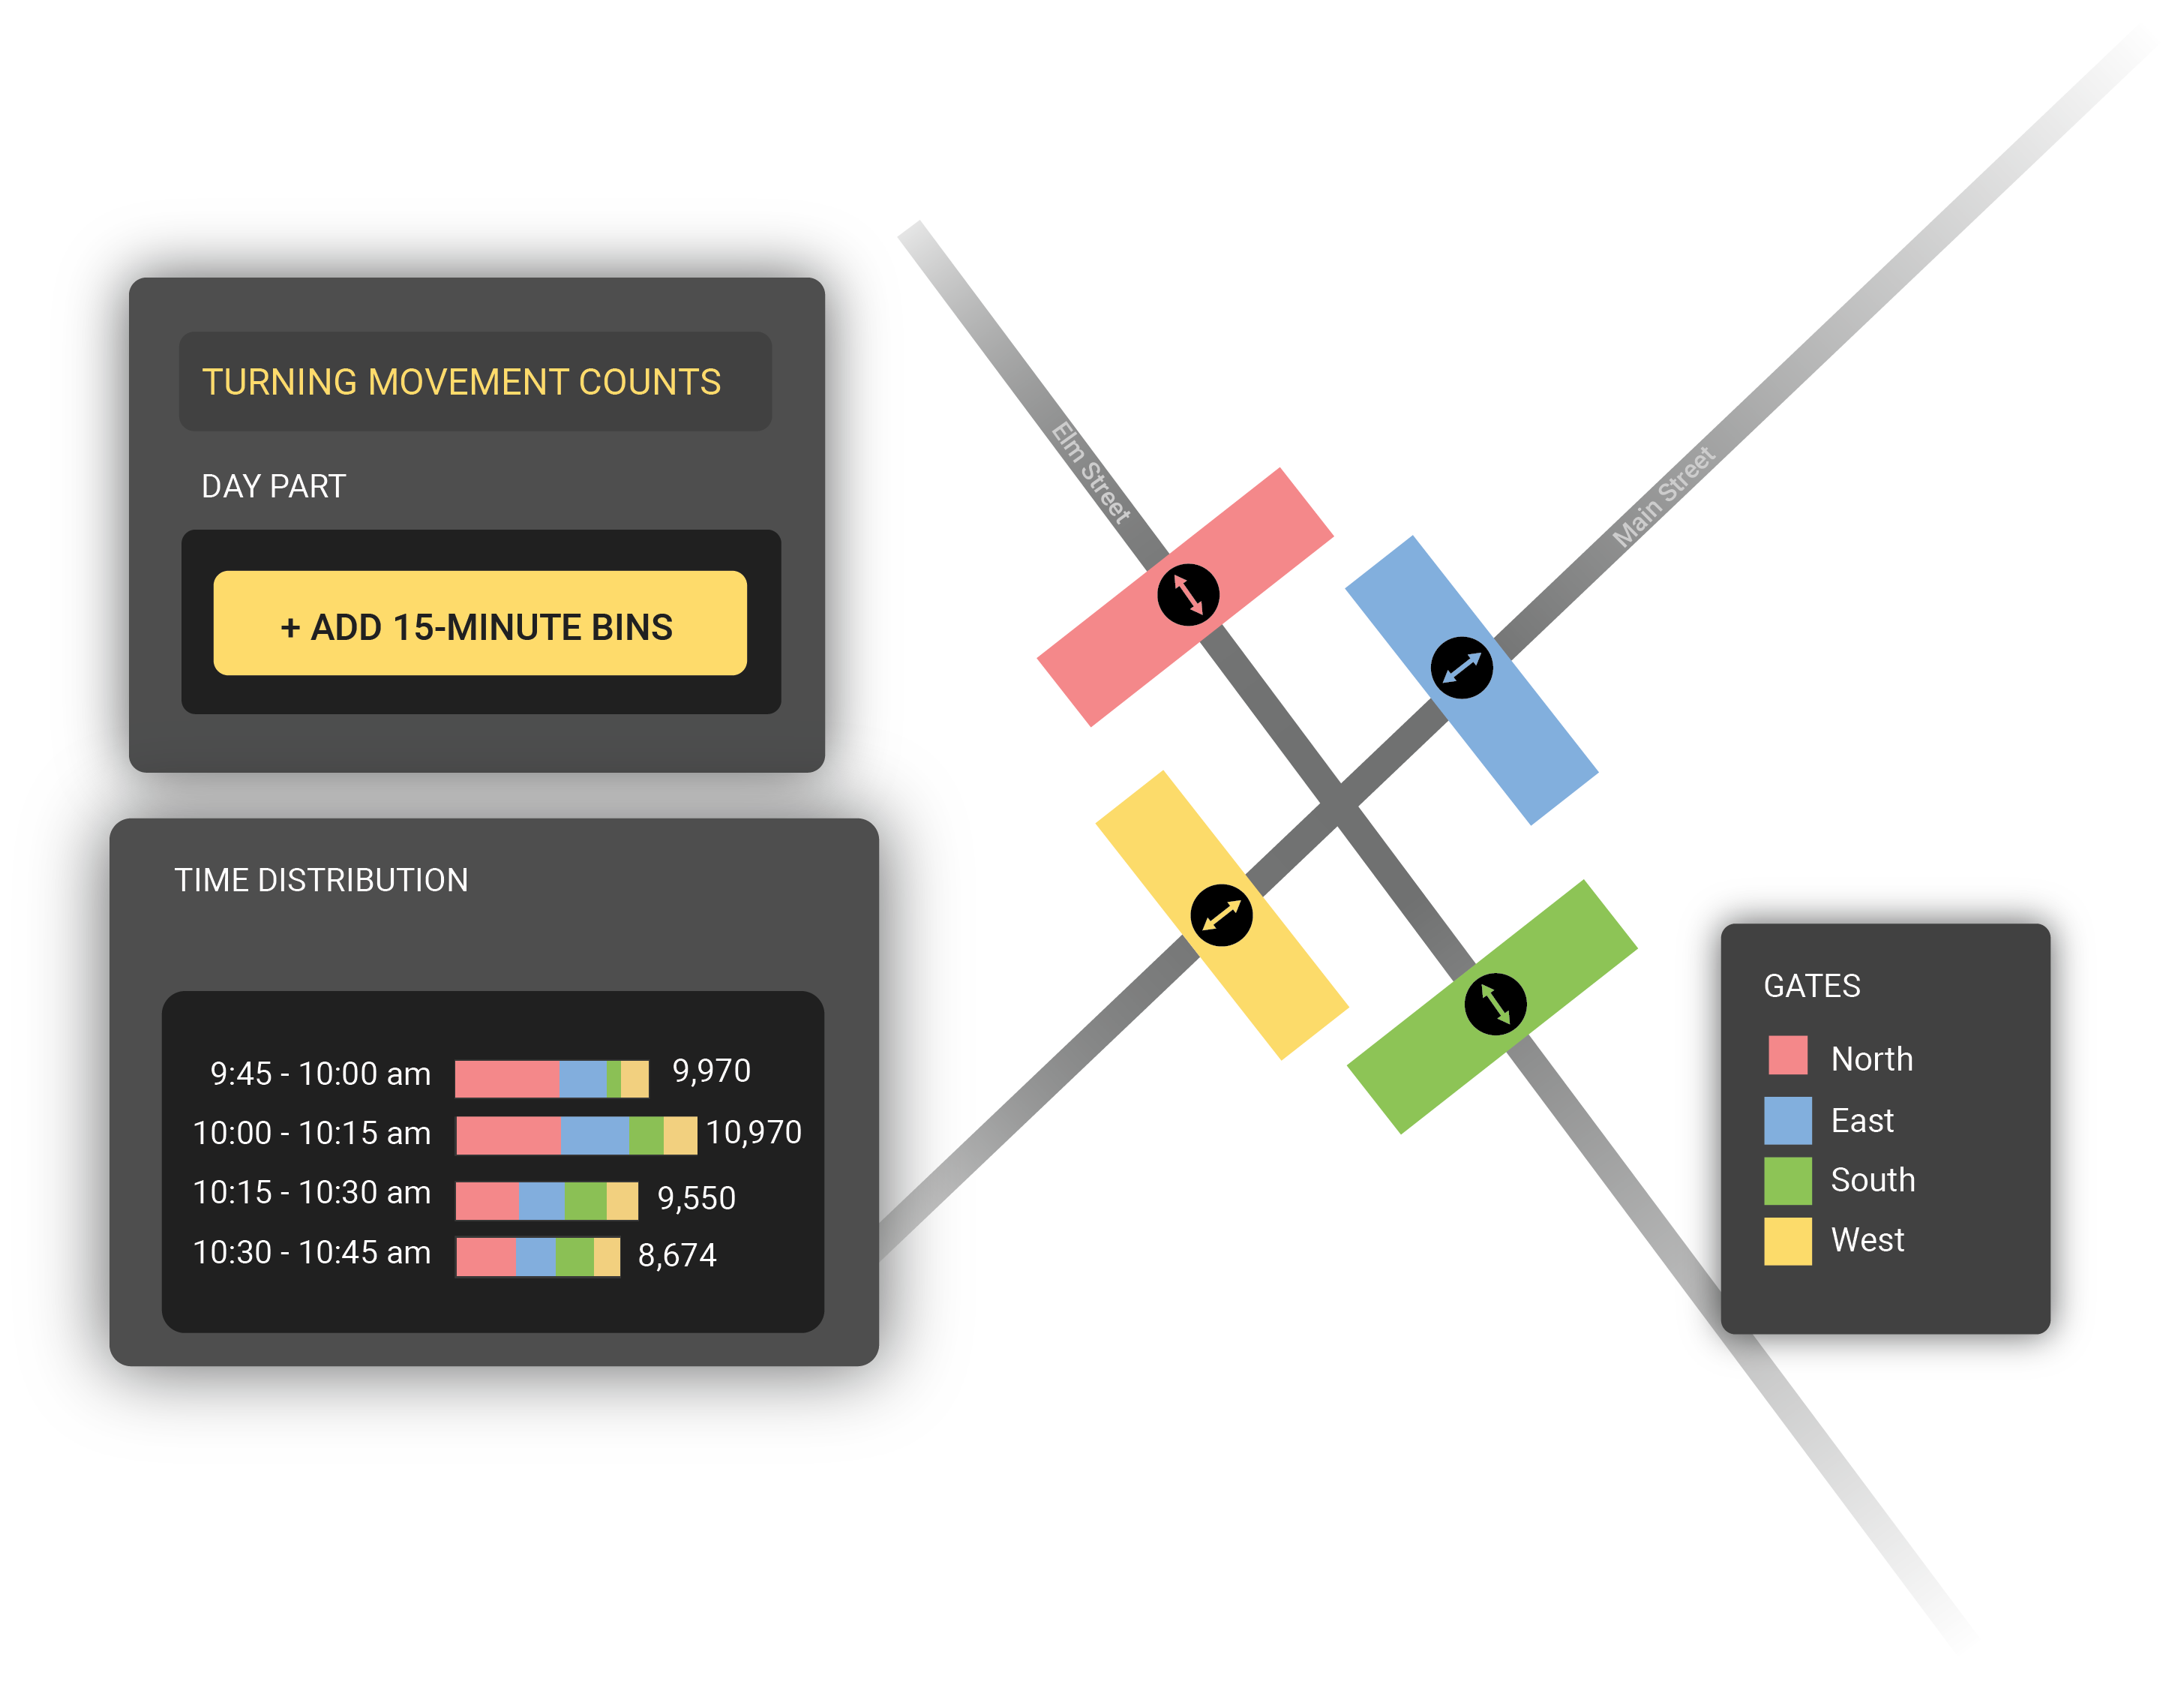
While this data can be collected manually, this process is cumbersome and costly. Since the 1970s, pneumatic tube counters have typically provided these counts every 24 to 48 hours, but such tubes often provide inaccurate data due to vehicle angles in intersections. It’s also expensive to lay down enough counters to collect sufficient data — each single-lane tube costs roughly $5,000, while each four-lane tube costs around $9,000.1
Planners can leverage Big Data to collect more frequent, accurate, and less expensive analytics on any intersection. Big Data can model 15-minute granularity for nearly every intersection — signalized or not — at any hour of the day, without the sample-size challenges of 48-hour counts. With this level of collection and analysis, planners can understand turning patterns and peak turning times for almost every road in the U.S. and Canada.
4. Vehicle Miles Traveled
To understand travel demand, measure emissions, evaluate multimodal infrastructure, and more, Vehicle Miles Traveled (VMT) is another critical metric for city transportation planners. VMT estimates the total mileage traveled by vehicles in the region or along specific corridors. This helps planners monitor changes in travel demand over time, allocate resources where they’re most needed, and understand how vehicle travel impacts road infrastructure and regional emissions.
With Big Data, planners have access to continuous, widespread VMT info for any road or region. This information makes it possible to build travel demand forecasts, plan for congestion relief, and direct regional and corridor traffic studies. VMT is also invaluable for detailed estimates of greenhouse gas emissions, fuel tax impacts, and more.
Big data transportation analytics platforms allow cities like Citrus Heights, California, to get comprehensive VMT metrics for every census block, meeting regional reporting requirements like SB 743, shedding light on city-generated transportation emissions, and guiding infrastructure improvements.
5. Vehicle Hours of Delay
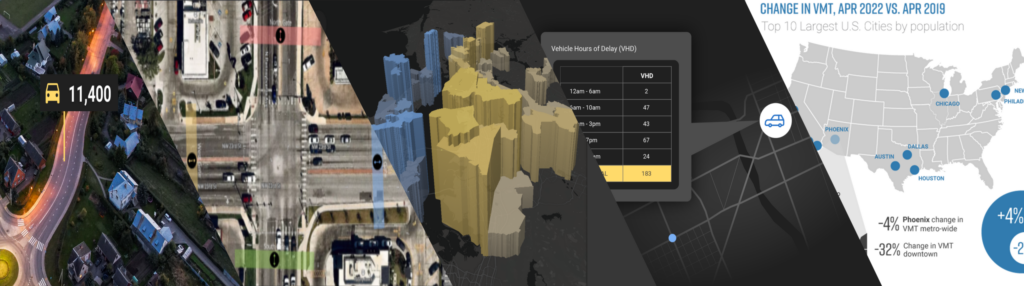
Vehicle Hours of Delay (VHD) is an essential metric for measuring congestion issues and targeting traffic bottlenecks. It provides the total number of hours lost to traffic delays in a given area during a specific time period. Understanding VHD can help planners quantify the severity and investigate the causes of traffic delays, as well as predict how road construction, special events, or bad weather may impact travel times. It is also critical for evaluating the effectiveness of traffic management strategies and more accurately forecasting which road improvements will reduce delays.
With StreetLight InSight®, planners can access historical and monthly delay metrics, providing visibility into fluctuations over time. This type of traffic data is invaluable in highly congested urban areas like Los Angeles or Chicago, where the success of each transportation initiative hinges on understanding the exact sources and nature of each bottleneck or problem area.
6. Vehicle Speeds
Vehicle speed metrics help city planners understand a variety of road conditions, particularly road safety and congestion.
Vehicle speed data is critical to measuring and improving road safety, especially when it comes to protecting Vulnerable Road Users like cyclists and pedestrians. To put this into perspective, data from AAA Foundation shows pedestrians are five times more likely to die from crashes when cars are traveling 40 mph vs. 20 mph. Vehicle speed metrics help city planners understand where high speed vehicles threaten the safety of all road users, and evaluate roadways for potential traffic calming strategies like road diets or speed humps.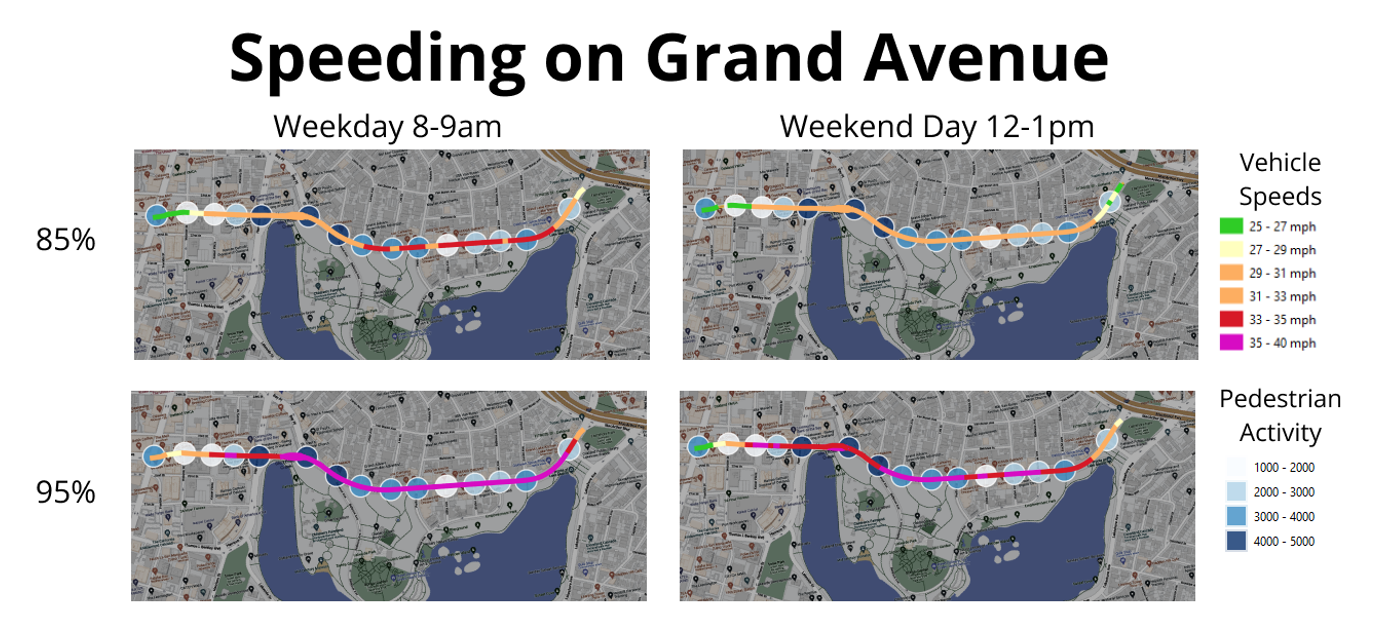
A data visualization shows where high vehicle speeds and high pedestrian activity overlap on a dangerous section of Oakland, California’s Grand Avenue.
Inversely, identifying areas with lower-than-expected vehicle speeds can help city planners identify areas of high congestion, and evaluate when that congestion is at its worst. Getting real-time data on vehicle speeds can even enable city traffic managers to quickly deploy congestion mitigation strategies like retiming smart traffic signals or deploying trained traffic controllers where needed.
While vehicle speeds can be collected from physical sensors like speed cameras or calculated based on the distance and travel time between two separate traffic counters, getting vehicle speed data for every roadway would require installing these types of sensors throughout a city’s entire road network, which is prohibitively expensive and time-consuming. Big data vehicle speed metrics can fill these gaps for cities that want to improve safety or congestion on city streets, even those without permanent counters installed.
Accessing the Data You Need, When You Need It
Solving regional transportation issues is a problem of massive scale and enormous import. Faced with millions of cars traveling thousands of miles per year and the pressing problems of urban congestion, transportation inequity, a pedestrian safety crisis, and greenhouse gas emissions, planners must have access to digestible, actionable metrics to understand and address the issues their constituents face. Injecting Big Data in transportation planning puts a better city mobility network within reach by delivering more information to demystify these common problems and their potential solutions.
With StreetLight InSight®, planners can access the most comprehensive suite of transportation data analytics on the market. While traditional collection methods and metrics are still useful for providing critical snapshots and verifying broader data sets, StreetLight’s Big Data analytics expand upon what’s possible with these traditional methods with 24/7 access to the metrics planners need to make more informed, data-driven decisions for any road and any mode.
To tap into the most comprehensive, up-to-the-minute transportation data on the market, get started with StreetLight today.
1. Federal Highway Administration. “A Summary of Vehicle Detection and Surveillance Technologies use in Intelligent Transportation Systems.” https://www.fhwa.dot.gov/policyinformation/pubs/vdstits2007/04.cfm