
The Waze Traffic Effect: 4 Steps for Cities & Neighborhood to Fight Back
Jump Ahead
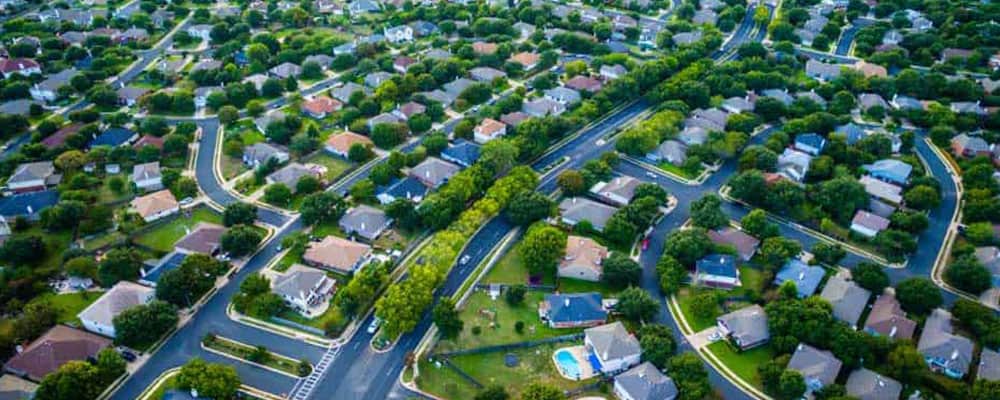
Thanks to navigation apps like Waze and Google Maps, GPS-enabled smartphones are changing the way we drive. It’s much easier to avoid a traffic jam or to find the closest gas station than it used to be. However, as many urban and transportation planners know, these apps have negative consequences.
When navigation apps route drivers through local roads in residential areas, they introduce congestion, air pollution, noise, and safety issues to streets that are designed for much low traffic volumes. The so-called “Waze Effect” is wreaking havoc on residential neighborhoods in all types of cities, especially during rush hour. It’s not only major metropolises such as Los Angeles, CA and Boston, MA that are impacted, but also smaller communities such as Fremont, CA and Takoma Park, MD.
So, what can transportation planners do about it? One way is to use the very data that smartphone apps create to your advantage. In this article, I’ll share four steps for cities to fight the Waze Effect with Big Data.
To explain this four step process, I’ll use a street in Takoma Park, Maryland, Elm Avenue, as an example. It’s neighborhood road in the Washington, DC suburbs that has been in the news for experiencing the “the Waze Effect.” As the Washington Post reports, one resident took matters into his own hands by reporting fake traffic incidents to Waze! That’s not a good long-term strategy. In fact, false reporting will get you banned from Waze.
So, let’s imagine we are transportation planners in Takoma Park. Multiple residents of the Elm Avenue area have raised concerns about increased traffic volumes with city officials. Our job is to figure out what’s happening and come up a strategy to address the situation. We’re concerned because it’s extremely difficult to measure the share of trips that are internal and external to a neighborhood using traditional data collection tools. With that in mind, these are four steps we’ll take next:
- Diagnose the Problem with Big Data
- Identify Data-Driven Solutions
- Test, Implement, and Measure Performance
- Engage the Public on What You’re Doing and Why it Works
Step 1: Diagnose the Problem
If you want to stop the Waze Effect, the first step is determine what type of traffic is on local roads in the first place – it’s important to confirm that cut-through trips are really the problem, not internal trips. With location data created by mobile devices, you can answer these types of questions about trips through neighborhood roads (or any other corridor!):
- What part of the corridor has the highest traffic volume?
- What share of trips in the corridor are cut-through? (Here we define “cut-through trip” as a trip that ends outside of immediate neighborhood, but you could define it differently in your own studies.)
- What are the origins and the destinations of the cut-through trips?

Learn how one city fought cut-through traffic
Learn MoreApproaching the problem empirically is key: Blaming traffic jams on outsiders is a pretty common knee-jerk reaction to congestion. Sometimes that reaction is right, but sometimes it’s incorrect. We’ve seen it happen with clients in Napa Valley, California: Locals assumed that tourists and cut-through commuters were the primary cause of traffic jams although inbound commuters and internal trips were important contributors to congestion. Seriously, even the Romans did this!
Where and When Are Traffic Volumes the Highest?
I ran a few StreetLight InSight® analyses on Elm Avenue in Takoma Park, Maryland to diagnose the problem. (StreetLight InSight is StreetLight Data’s on-demand Big Data analytics platform.) My first step was to look at hourly traffic volumes and Free Flow Factor on different segments of the corridor. This helped me identify the parts of Elm Avenue with the most traffic and congestion at different times of day.
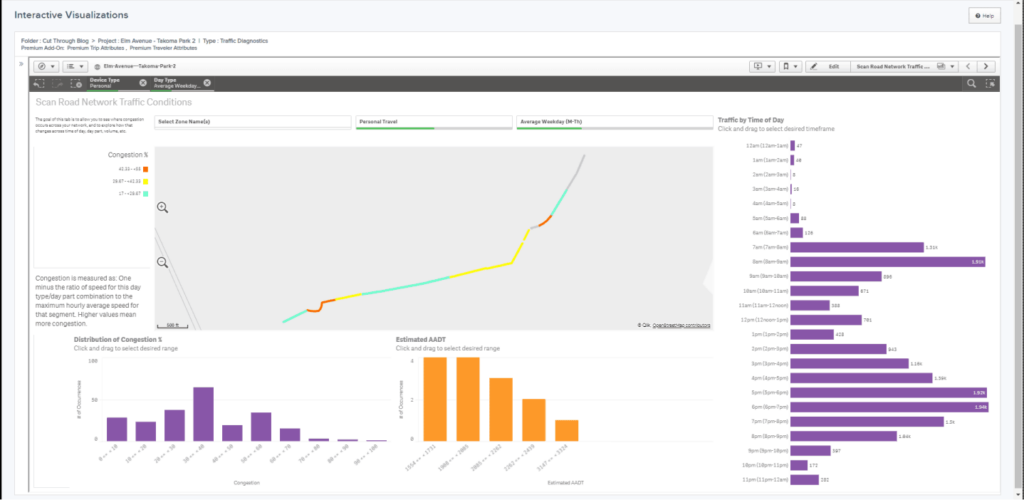
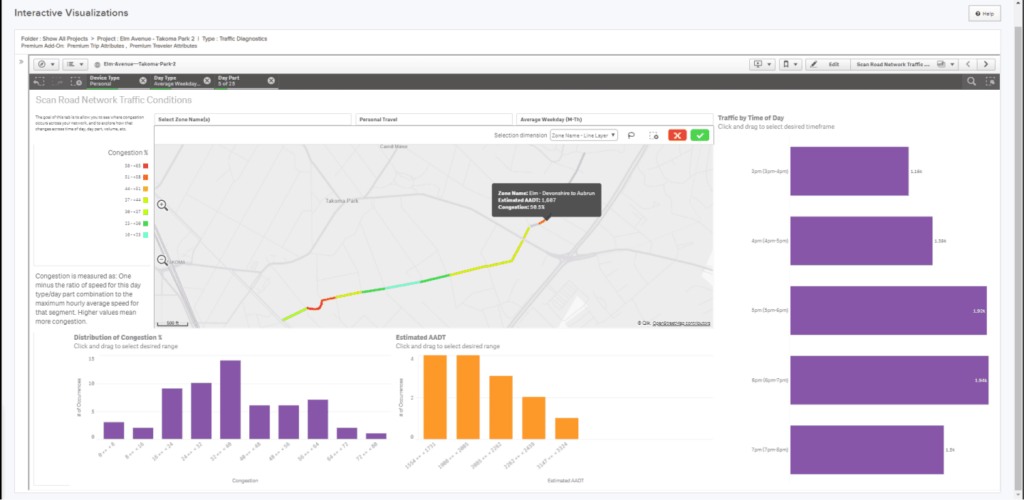
With this information, I can focus the next phase of my analysis. To keep things simple for this blog article, I’m going to focus on the section of Elm Avenue from Devonshire to Auburn: This is one of the segments of Elm Avenue with the highest traffic volume during Peak PM hours on weekdays.
What Share of Trips are Cut-Through?
My next step was to determine the share of trips on our “problem segment” of Elm Avenue that are cut-through during the weekday PM rush hour (3pm – 7pm). To do this, I created an Origin-Destination Analysis in StreetLight InSight as shown in Figure 1 below.

Next, I built a simple pivot table using transportation analytics that I downloaded from StreetLight InSight. In less than two minutes, I calculated the share of trips that pass through this segment of Elm Avenue and then stop in the neighborhood versus the share of trips that just passed through. (See Figure 4). Simply put, the data shows that the residents of Elm Avenue have good reason to complain! My analysis revealed that:
- Just ~23% of trips that pass through this segment of Elm Avenue stop in the neighborhood.
- Of course, this means more than 75% of trips are cutting through!
- Elm Avenue isn’t the only road worth studying: One of the most popular routes for exiting the neighborhood is Auburn Avenue (near the intersection with New Hampshire Avenue). Elm Avenue (near the intersection with Ethan Allen Avenue) is the 2nd most popular.
The Origins and Destinations of External Trips on Elm Avenue
My next question was: where are all of these cut-through drivers going? To answer this question, I analyzed the origins and destinations of the trips that pass through the problem segment of Elm Avenue during the weekday Peak PM rush.
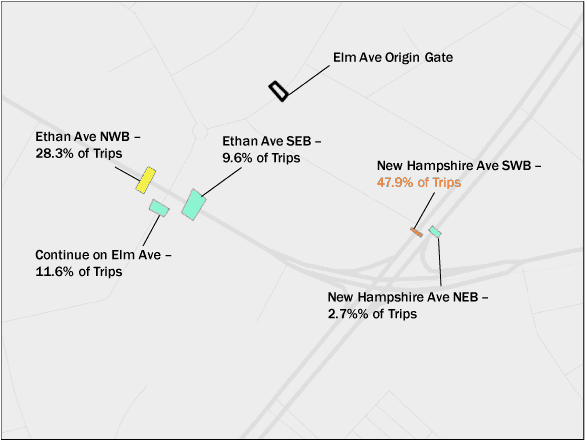
First, I wanted to drill down on the most popular “exit routes” in finer resolution. I ran a second Origin-Destination Analysis that focused on just two exit routes: the intersection of Auburn and New Hampshire Avenue and the intersection of Elm and Ethan Allen Avenue. I used the same Pass-Through Origin Zone on the problem segment of Elm Avenue, but I set up new Pass-Through Destination Zones around each of these two intersections.
To analyze this data, I visualized the results as a heat map (see below). It shows that nearly 50% of trips in this study are using Elm Avenue to access to New Hampshire Ave in the south west direction.
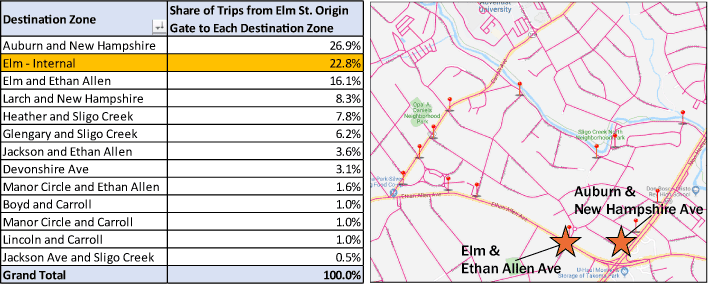
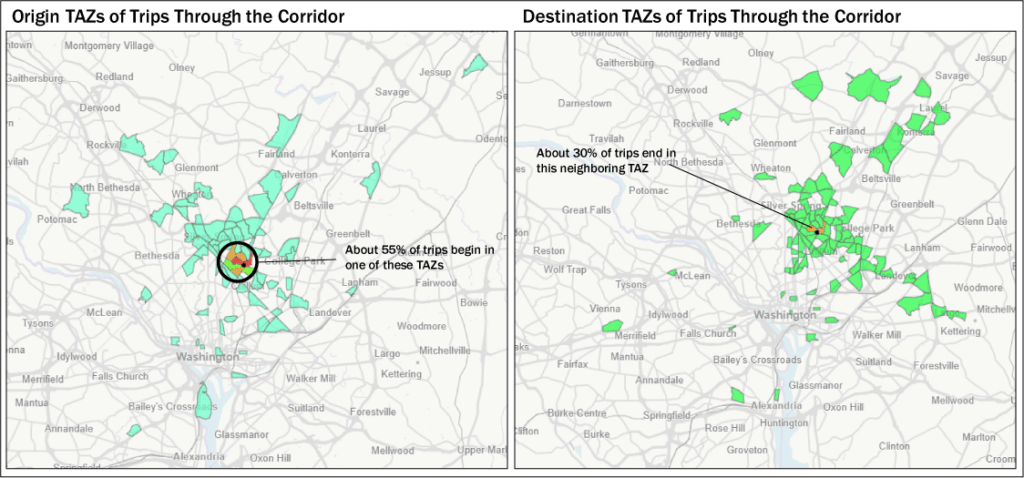
Next, I ran an Origin-Destination to Preset Geography analysis, which scans all of the origins and destinations of the trips that pass through, start, or stop in any geographic area. This allowed me to identify the transportation analysis zone (TAZ) that the cut-through trips begin and end in.
Once again, I used the problem segment of Elm Avenue as my analysis Zone. The results in Figure 7 show that the majority of trips – 55% – on this corridor originate nearby. While 30% of trips end in the exact same TAZ as the corridor, the destinations are much more spread out across the region overall.
With these Big Data analyses from StreetLight InSight, I now have a much better understanding of the traffic that passes through Elm Avenue. I’ve determined that:
- More than 75% of trips on the problem segment of Elm Avenue are cutting through.
- Nearly 50% of trips that use one of the top 2 most popular exit routes are proceeding to New Hampshire Avenue in the south west direction.
- Most drivers who are using this cut-through start their journeys nearby.
With this information, I can move to step 2: Identifying data-driven solutions.
Step 2: Identify Data-Driven Solutions
The next step is to use the information we’ve gathered about travel patterns on the neighborhood road to identify potential solutions. One challenge in reducing cut-through trips on neighborhood roads is that restrictions are likely to impact residents of these streets, too. That’s why designing them to target cut-through drivers specifically – and not enacting more restrictions than necessary – is important. Using Big Data to drill down on the most important segments and intersections to target can help minimize the impact on local residents. A few ideas come to mind immediately:
- Restrict turns from Auburn Avenue to New Hampshire Avenue during Peak PM hours.
- Put a traffic signal at the Auburn and New Hampshire Avenue intersection to make the route less efficient for cut-through drivers.
- Lower the speed limit of Auburn Avenue or add speed bumps to make the route less efficient for cut-through drivers. (Note: There already are speed bumps on Elm Avenue!)
- Target outreach about the negative impact of cut-through trips to employers and commercial properties in the local area.
- Install bollards at the intersection of Auburn Avenue and New Hampshire Avenue to prevent cut-through drivers from using this route. (This is a drastic option, so it may not win residents’ approval…)
Of course, this is just the beginning. If I really were a transportation planner in Takoma Park, my next step would be analyzing additional segments of Elm Avenue. Expanding the analysis to consider other factors that influence cut-through trips would also be helpful. For example, I could also analyze the most popular entry points for drivers using this segment of Elm Avenue. This would help me identify more mitigation tactics. To give you a sense of the possibilities, here are a few other facts I could glean from Big Data analyses to design data-driven solutions:
- The amount of time typically saved by cutting through Elm Avenue
- The purposes of the trips through the corridor
- The aggregate incomes of cut-through drivers

Learn how one city fought cut-through traffic
Learn MoreStep 3: Test, Implement, and Measure Performance
The next step is to test your tactics and measure how they perform empirically. Establish a time period for your test of the new tactics, and inform the community about the upcoming changes. As the trial unfolds, use Big Data to study the impact of your mitigation tactics.
With StreetLight InSight, you can do this quickly and easily on your computer. Using Big Data to monitor performance allows you to track progress on an ongoing basis and shift your approach if your strategies aren’t delivering good results. Measuring performance over time is particularly important to managing the Waze Effect: these apps are designed to stay one stay ahead of the curve, and drivers may switch to a new cut-through option next. If you’re always monitoring the travel activity in your area, it’s much easier to stay on top of issues before they snowball into major problems.
Step 4: Engage with the Public on What You’re Doing and Why it Works
Keep the public posted on the results of the new program. By sharing real-world data that is intuitive for the public to understand, you can build buy-in for your policies and generate support from the community. Explain your findings with stakeholders in city council and with residents in public engagement meetings, through newsletters, and any other communications channels that you’ve found to be effective in your community.
Continue to measure performance to ensure your tactics are still effective over time, and keep telling your data-driven story to residents before, during, and after your implementation. We love this example of a newsletter to residents published by the City of Fremont, California.
Ready to Fight Back Against Waze Effect?
I hope this article has proved to you that Big Data is a powerful tool for fighting back against the Waze Effect. To learn more about our StreetLight InSight platform and find out if it can help you combat cut-through trips, sign up for a free consultation today.

Learn how one city fought cut-through traffic
Learn MoreReady to Fight Back Against Waze Effect?
I hope this article has proved to you that Big Data is a powerful tool for fighting back against the Waze Effect. To learn more about our StreetLight InSight platform and find out if it can help you combat cut-through trips, sign up for a free consultation today.