What Is a Road Diet? The Data Behind How They Work and How To Implement Them
By removing or repurposing one or more lanes of traffic, road diets promote positive mobility outcomes from improved safety to reduced emissions. But despite proven success, some find the approach controversial.

Jump Ahead
Since the 90s, road diets have become a popular tactic to calm traffic and implement multimodal transportation options. But planners and advocates often face resistance from those who are worried that fewer lanes will lead to more congestion.
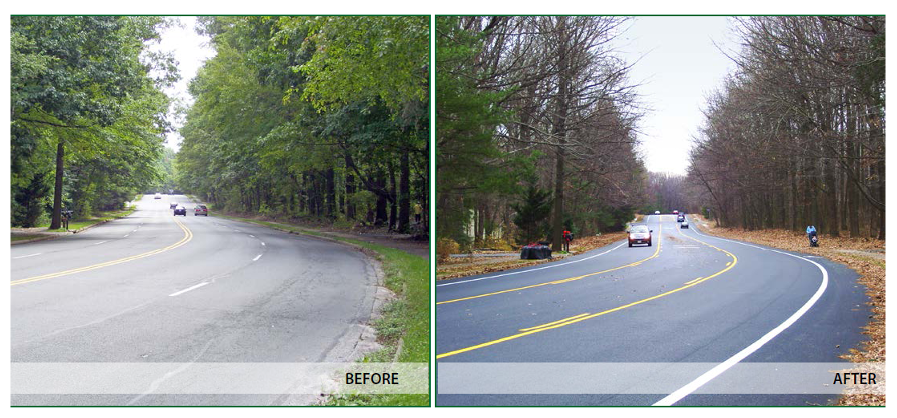
A road diet reconfigures an existing roadway by removing or repurposing lanes devoted to vehicle traffic. The overall impact is typically fewer cars on the road and reduced travel speeds, often for the relatively low cost of restriping.
The most traditional version of a road diet reduces the total number of lanes on a roadway by converting one or more lanes into a central turn lane that both traffic directions can use to make left turns.

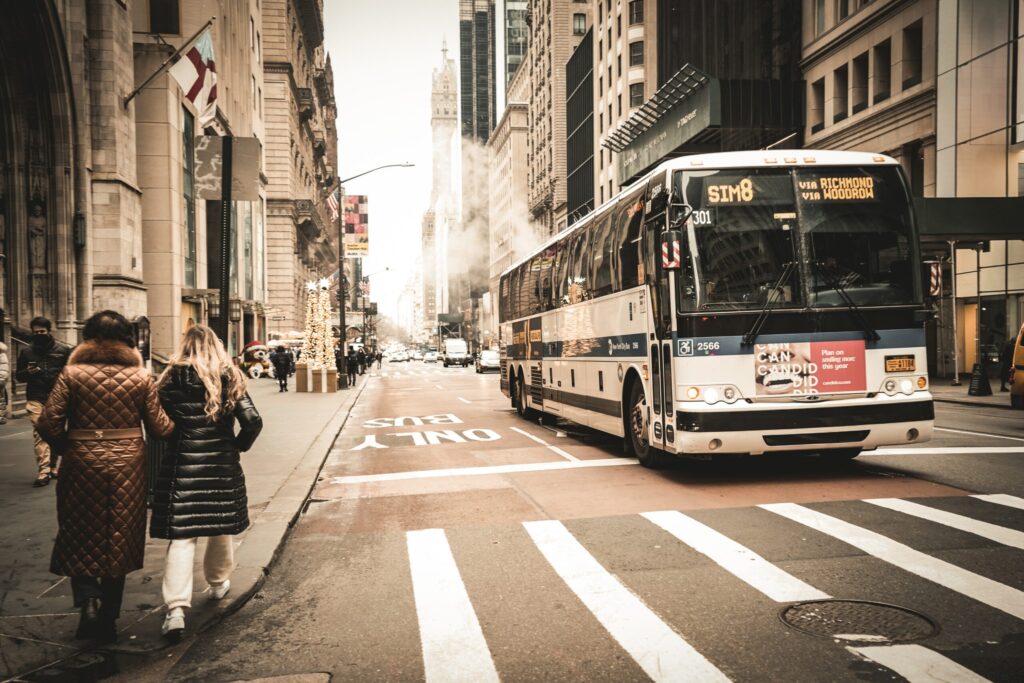
Other types of road diets might convert one or more existing lanes into bike lanes, bus-only lanes, medians, sidewalks, or landscaping.
And in spite of the concerns often raised by public and political stakeholders, road diets have stood the test of time. According to the FHWA, they have been in use for more than three decades, with one of the first installations dating back to 1979 in Billings, Montana. Since then, they’ve improved safety and mobility outcomes for roads in Charlotte, Chicago, New York, San Francisco, and many other cities across the U.S. [1]
Road diets have been gaining more attention since the pandemic as biking activity increased. Simultaneously, speeds have also increased, creating dangerous conditions for those in vehicles as well as those on foot or bike. According to the National Highway Traffic Safety Administration (NHTSA), there were over 6,000 pedestrian fatalities in 2020, a 3.9% increase from 2019, while pedestrian injuries rose 28% from 2019 to 2020. [2]
Meanwhile, the Bipartisan Infrastructure Law (BIL) has put a special focus on safety infrastructure, establishing grant programs like Safe Streets and Roads for All (SS4A). The U.S DOT webpage on the SS4A grant program lists road diets under their examples of eligible low-cost safety treatments for Implementation Grant funding. [3]
But why do road diets work, and what makes them a popular tactic for many DOTs, MPOs, and other public agencies? In this post, we’ll cover:
- How road diets improve safety
- How road diets reduce vehicle traffic
- How road diets cut greenhouse gas (GHG) emissions
- Road diet examples and the data behind their success
Take action on unsafe streets with speed data, bike/ped metrics, and more
Download Safety HandbookHow Does a Road Diet Improve Safety?
Speed is among the primary factors in road safety, with higher speeds leading to more severe crashes. That’s one reason why road diets are so effective in improving safety for all road users.
With multiple lanes in each direction of travel, drivers are quick to speed up and pass other vehicles, hoping to get to where they’re going as quickly as possible. Adding to the problem, roads with little to no multimodal infrastructure signal to drivers that there is no need to slow down for more vulnerable road users such as pedestrians, cyclists, or road workers.
According to the FHWA,
Four-lane undivided highways experience relatively high crash frequencies — especially as traffic volumes and turning movements increase over time — resulting in conflicts between high-speed through traffic, left-turning vehicles and other road users. FHWA has deemed Road Diets a proven safety countermeasure and promotes them as a safety-focused design alternative to a traditional four-lane, undivided roadway. [4]
In fact, FHWA studies of road diet projects have found that reducing the number of lanes dedicated to cars reduces crashes by 19 to 52% due to reduced speeds and fewer opportunities for collisions. [5]
When a road diet repurposes the existing space for multimodal or more accessible infrastructure such as widened sidewalks, bike or bus lanes, or pedestrian safety islands, they also use Complete Streets principles to make the roadway safer for all road users, regardless of their mode of travel.
The overall effect of reducing vehicle lanes and reclaiming space for non-vehicle modes is traffic calming. By encouraging slower driving and less vehicle throughput, road diets reduce exposure for Vulnerable Road Users and lessen the severity of crashes that do occur.
How Does a Road Diet Reduce Vehicle Traffic?
People often worry that removing lanes will just make driving more miserable. After all, fewer lanes means less road capacity for cars, creating bottlenecks where traffic could once flow freely. At least, that’s the concern.
But in reality, road diets rarely lead to increased congestion. There are a few reasons why.
The first has to do with reduced demand. You may have heard that increasing the number of lanes on a highway often has the paradoxical effect of increasing congestion. That’s because adding lanes induces demand, leading more people to choose to drive on that roadway. By the same token, removing lanes actually reduces demand. But where do those travelers go?
Some traffic may reroute to nearby roadways while other drivers may choose to travel via other modes. After all, with fewer cars and lower travel speeds, the road is now safer for pedestrians and cyclists. Especially so if the lanes have been repurposed for multimode infrastructure like bike lanes or sidewalks. Likewise, a road diet might repurpose an existing lane for bus-only traffic, incentivizing more travelers to use public transit options that reduce the number of vehicles on the road.
In one road diet example on Ocean Park Blvd in Santa Monica, California, the city restriped 4 lanes of roadway into 3 lanes including a central left turn lane, plus added bike lanes in both directions. While there was public concern that traffic would reroute to nearby roadways like the I-10, a study of traffic counts showed volumes on nearby roadways remained relatively stable. Meanwhile, there was a 65% reduction in crashes after the road diet was implemented. [6]

How Does a Road Diet Cut GHG Emissions?
By reducing the number of cars on the road, road diets also reduce overall Vehicle Miles Traveled (VMT), leading to local reductions in greenhouse gas (GHG) emissions.
The potential for a road diet to reduce emissions is enhanced when lanes are repurposed for multimodal infrastructure that encourages climate-friendly travel options like walking, biking, and public transit.
Plus, when road diets are used as a traffic calming measure — i.e., to reduce overall traffic speeds — they may also reduce fuel consumption and thereby reduce emissions. This is because cars are less fuel efficient and produce more CO2 per mile traveled when traveling at higher speeds.
For example, in the video below, the Southern Maine Planning & Development Commission explains how they used VMT and Origin-Destination analyses in StreetLight InSight® to measure local GHG emissions. What they learned helped them plan regional reduction strategies, including multimodal infrastructure that would reduce VMT.
Real Road Diet Examples and the Data Behind Their Success
To plan an effective road diet, you first need to get the full picture on travel behaviors. Traditional data collection methods like sensors and surveys can help planners measure existing conditions like roadway volumes, travel speeds, and turning movements.
But many roads lack permanent sensors, and temporary sensors and manual counts only get a snapshot of roadway conditions, so planners may miss how conditions change over the course of the day, week, or year. Likewise, surveys suffer from low sample sizes and can be expensive and time-consuming.
Pairing traditional data collection methods with on-demand transportation analytics gathered through connected vehicles and the Internet of Things can help fill data gaps to not only plan new road diets but also evaluate the success of existing road diets, offering historical data for before-and-after studies.
For example, in the video below, Maine DOT explains how they used StreetLight’s traffic data including Turning Movement Counts, Origin-Destination analyses, and roadway volume in their modeling efforts to help evaluate safety and mobility outcomes for a proposed road diet on Bangor Street that would reduce traffic to one lane in each direction.To find good candidates for road diets, Annual Average Daily Traffic (AADT) and Vehicle Miles Traveled (VMT) can be used to identify high-volume roadways and segments where road diets may be the most impactful.
Pairing these insights with travel speeds, crash reports, and pedestrian and cyclist activity is a crucial next step to illuminate where volume is high and safety is low, revealing high-priority locations for potential road diets that could save lives.
Turning Movement Counts (TMC) at intersections along a corridor can also help determine whether a traditional road diet (turning existing lanes into a center, two-way left-turn lane) may ease traffic flow.
To understand how a road diet may impact traffic on nearby roadways, Origin-Destination and Top Routes analyses can help pinpoint where cars and trucks may reroute, giving planners the opportunity to ensure sufficient capacity on nearby roads, especially if the road diet does not include plans to add multimodal infrastructure.
To evaluate the impact of a road diet, before-and-after studies measuring changes in overall roadway volumes, safety outcomes, and congestion metrics like Vehicle Hours of Delay (VHD) can help ensure a road diet is achieving its desired outcomes and provide justification for future road diet projects.
Since road diets often face resistance, quantifying the success of past road diets and showing how you will measure traffic impact can help answer constituent concerns around travel time impact.
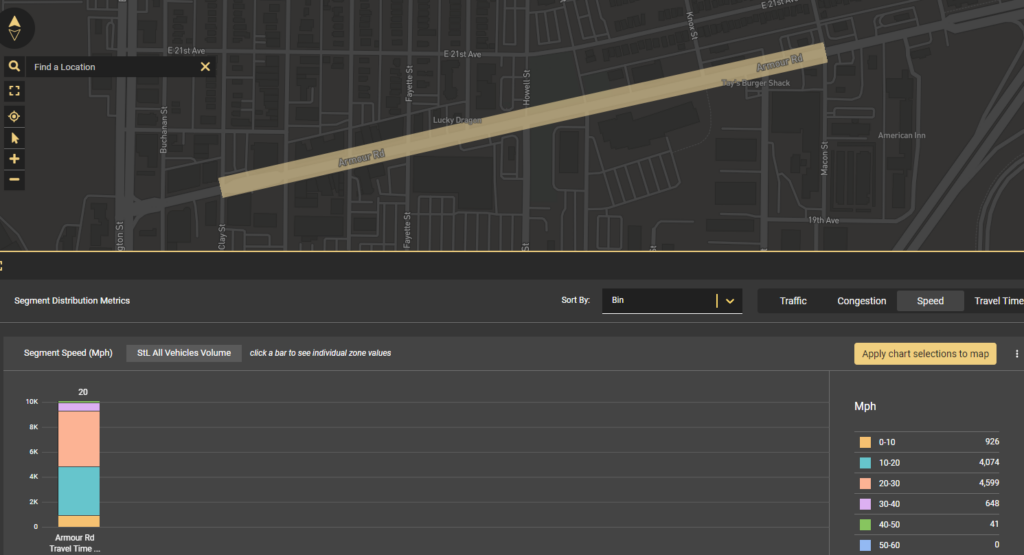
For example, in 2019, Armour Road in North Kansas City, Missouri underwent a series of improvements, including the addition of a new protected bike lane and pedestrian refuges. A before-and-after study by StreetLight shows a significant reduction in dangerous vehicle speeds, double the biking activity, and a negligible increase in travel times (around five seconds on average) along the corridor.
Metrics to Measure Traffic Volume and Roadway Capacity
– AADT, VMT
To find good candidates for road diets, Annual Average Daily Traffic (AADT) and Vehicle Miles Traveled (VMT) can be used to identify high-volume roadways and segments where road diets may be the most impactful.
Metrics to Diagnose Road Safety Risks
– Travel speeds, crash rates, pedestrian & cyclist activity
Pairing traffic volume insights with travel speeds, crash reports, and pedestrian and cyclist activity is a crucial next step to illuminate where volume is high and safety is low, revealing high-priority locations for potential road diets that could save lives.
Metrics for Planning Road Diet Implementation
– TMC, O-D, Top Routes
Turning Movement Counts (TMC) at intersections along a corridor can also help determine whether a traditional road diet (turning existing lanes into a center, two-way left-turn lane) may ease traffic flow.
To understand how a road diet may impact traffic on nearby roadways, Origin-Destination and Top Routes analyses can help pinpoint where cars and trucks may reroute, giving planners the opportunity to ensure sufficient capacity on nearby roads, especially if the road diet does not include plans to add multimodal infrastructure.
Metrics to Measure Road Diet Success
– Changes in VHD, AADT, VMT, travel speeds, crash rates, O-D, Top Routes, bike and pedestrian activity, and more
To evaluate the impact of a road diet, before-and-after studies measuring changes in overall roadway volumes, traffic routing, safety outcomes, and congestion metrics like Vehicle Hours of Delay (VHD) can help ensure a road diet is achieving its desired outcomes and provide justification for future road diet projects.
Since road diets often face resistance, quantifying the success of past road diets and showing how you will measure traffic impact can help answer constituent concerns.
For example, in 2019, Armour Road in North Kansas City, Missouri underwent a series of improvements, including the addition of a new protected bike lane and pedestrian refuges. A before-and-after study by StreetLight shows a significant reduction in dangerous vehicle speeds, double the biking activity, and a negligible increase in travel times (around five seconds on average) along the corridor.
When road diet proposals spark public outcry, congestion and travel time are typically peak concerns, but residents may also cite safety concerns like increased emergency response times or economic impacts on nearby businesses due to reduced traffic and parking availability. In these cases, analyzing multimodal activity that could boost visits to businesses and nearby road capacity that can accommodate emergency services rerouting could also help assuage concerns.

To learn more about how on-demand transportation data can enhance safety planning, download our free Safety Data Handbook.
- U.S. DOT Federal Highway Administration. “Road Diets (Roadway Reconfiguration).” October 25, 2022.
- NHTSA. National Pedestrian Safety Month 2022 Resource Guide. October 2022.
- U.S. DOT, “Safe Streets and Roads for All (SS4A) Grant Program.” April 26, 2023.
- U.S. DOT Federal Highway Administration. “Road Diets (Roadway Reconfiguration).” October 25, 2022.
- Andrew Keatts, Rice University Kinder Institute for Urban Research. “What Are ‘Road Diets,’ and Why Are They Controversial?” September 10, 2015.
- Federal Highway Administration, Road Diet Case Studies. “Santa Monica, California – Ocean Park Boulevard: Road Diet Improves Safety Near School.”

Take action on unsafe streets with speed data, bike/ped metrics, and more
Download Safety HandbookReady to dive deeper and join the conversation?
Explore the resources listed above and don’t hesitate to reach out if you have any questions. We’re committed to fostering a collaborative community of transportation professionals dedicated to building a better future for our cities and communities.