Why Work-From-Home Didn’t Lower Climate Change Impact
Studying vehicle travel during 2020 provided many unique opportunities for transportation data analysis, thanks to reduced travel activity. At the beginning of the pandemic, transportation planners speculated that work-from-home policies might positively affect climate change by reducing emissions. It’s a tempting alternative to expensive and time-consuming infrastructure or policy changes.
This is the beauty of data – sometimes we have an expectation, or a hunch, or a guess, and data-backed insights can prove or disprove it. We analyzed VMT extensively in our 2020 U.S. Transportation Climate Impact Index, so let’s draw from that to take a deeper look at what WFH policies could actually mean for the climate change conversation moving forward.
Driving Miles Fell Dramatically in 2020
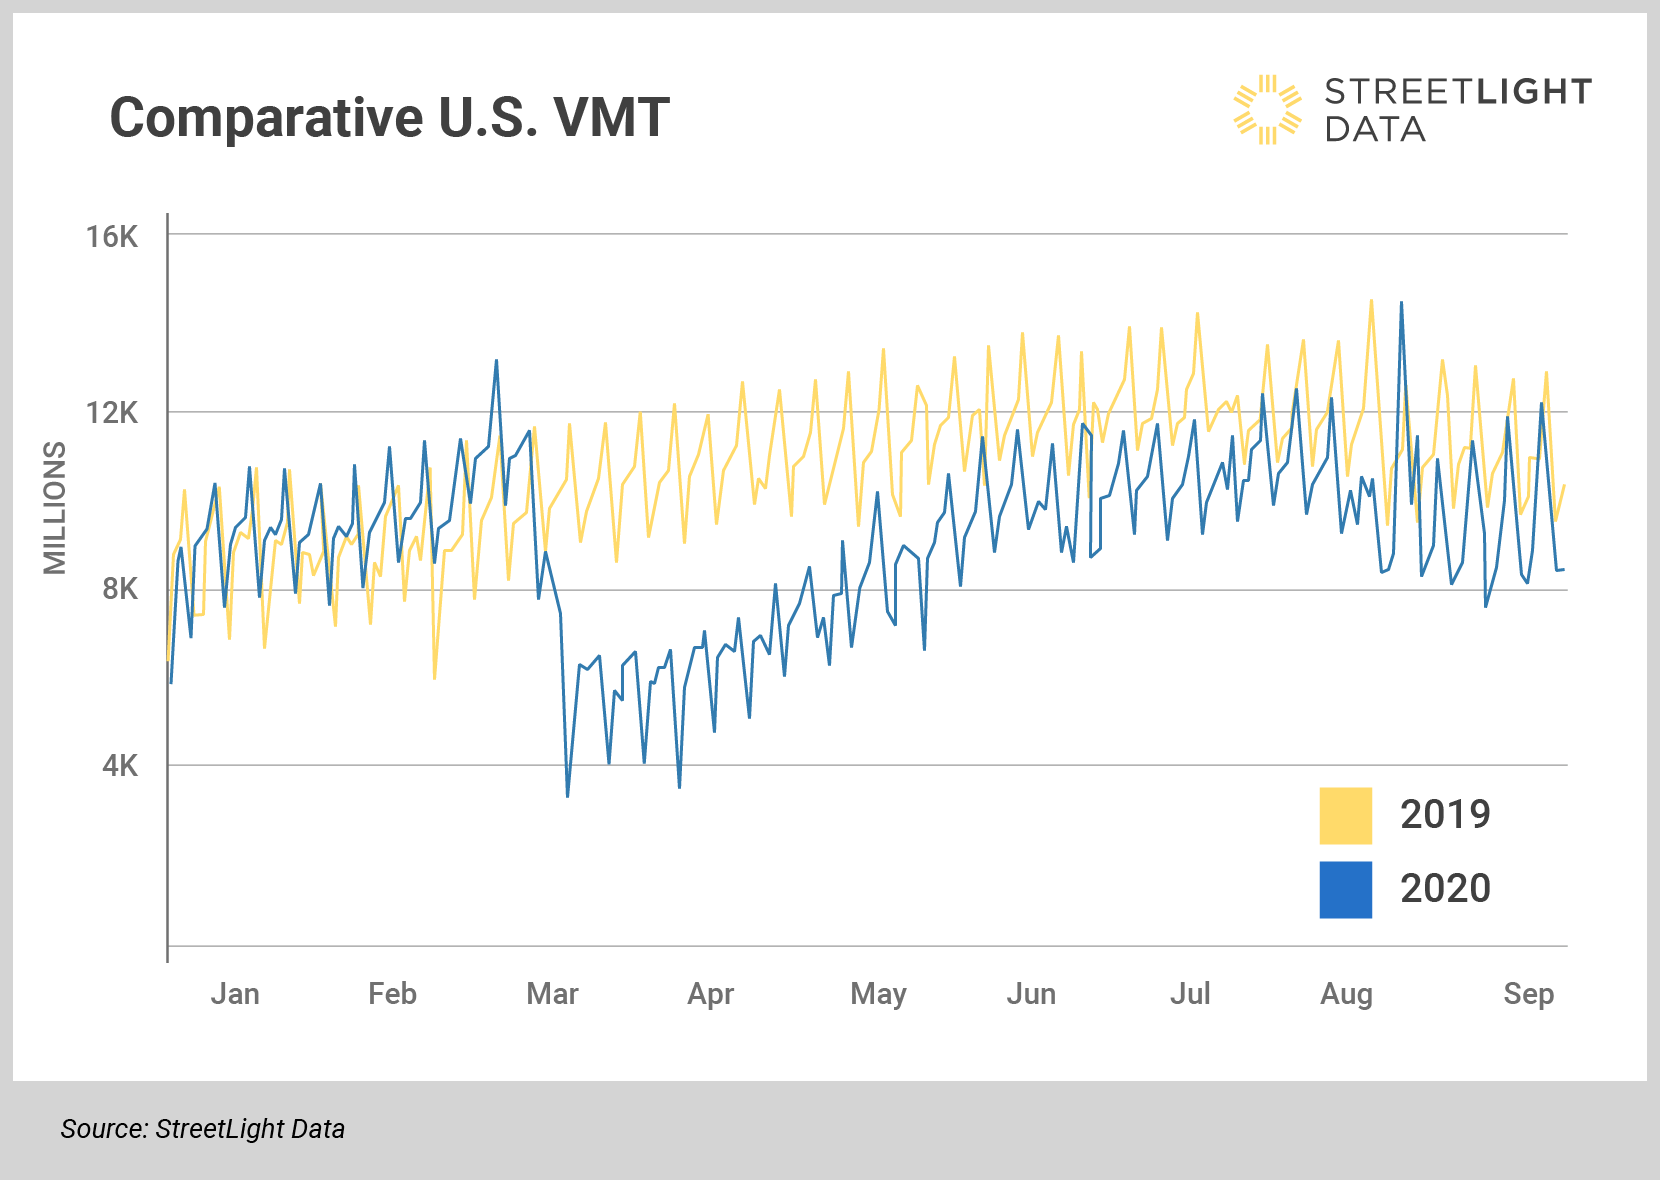
Initially, VMT fell to new lows as populations hunkered down in response to the virus reaching U.S. shores. By March, annual average VMT for the U.S. fell to 5.5 billion. The average for March the previous year was double, at 10.5 billion.
Figure 1: Although driving decreased in early spring of 2020, by the fall average VMT was back to normal levels.
The metro New York area witnessed such disruption in driving that it landed at our number 7 lowest VMT ranking in 2020, a dramatic difference from its 2019 ranking of 80. And while population shifts – including people leaving the city due to pandemic fears – may have contributed to the change, there’s no doubt that one of the largest U.S. cities did experience a huge decrease in commute driving.
Some transportation experts hoped that WFH policies could reduce transportation’s impact on climate change, and that we could explore ways to keep it permanently low. The pandemic’s drastic drop in commuting nationwide offered us a unique opportunity to analyze actual data.
Work-From-Home Isn’t Magic
The rise in remote work might suggest that transportation planners could embrace this option in addition to (or even instead of) regulation or infrastructure planning. Could solutions that change the structure of work have a lasting impact on transportation emissions? Let’s look at the analysis results.
- First, and obviously, not everyone can work from home. Our data indicates that only about 9% of typical household VMT comes from commuters who have the potential to work from home. The rest of the world (including essential workers and hourly shift workers) must commute to a specific work location. And most driving is non-commute travel anyway — people running errands or shopping.
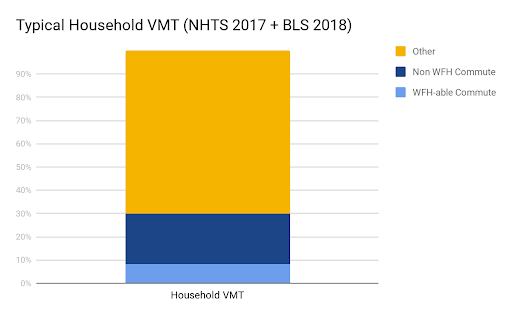
Figure 2: Only 9% of household vehicle travel can be attributed to commutes for employees who could shift to work-from-home.
Second, WFH didn’t necessarily mean all workers were driving less. Many just may have been driving differently. Our analysis found a shift in peak driving hours, with a dip in morning driving but a slight rise and wider peak time for afternoon driving. Also, essential workers still commuted, and Census data showed a large increase in online retail, which created more delivery vehicle miles.
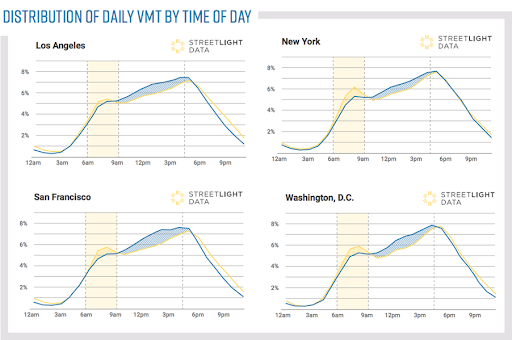
Figure 3: Comparing 2019 trends (yellow) to 2020 (blue) shows that while morning rush hour volume decreased, afternoon peaks spread.
- Third, WFH didn’t permanently reduce the amount of transportation. Although VMT dropped drastically in early spring, by August it already had begun to rise again. August and subsequent months looked much closer to previous 2019 levels, with over 12,000 VMT in August 2020, just like 2019.
Addressing Transportation’s Role in Climate Change Takes More
So what does this mean? WFH policies didn’t translate to permanent reductions in transportation vehicle emissions. That means we must develop other initiatives to support transportation climate policies.
Intentional restructuring after COVID is the only way to create lasting change. The pandemic forced everyone to rediscover what work looks like, and now we have an incredible opportunity to reinvent work and its related transportation needs. Keeping WFH policies while supporting low-carbon transportation modes and increasing vehicle efficiency can create the impactful change we seek.
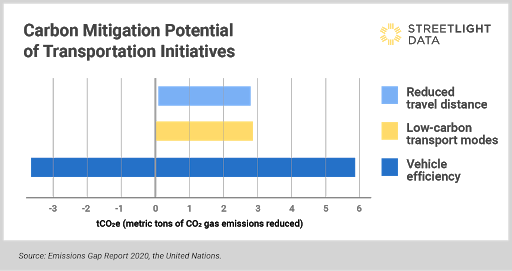
Figure 4: Increasing vehicle efficiency has the biggest potential to mitigate transportation emissions.
It would be wonderful to solve climate change by increasing remote work, but transportation’s contribution to climate change is complex.
We were able to explore remote work’s role in climate change because of unprecedented events in 2020. The data can capture moments like that and allow transportation planners to build on the insights. Data can help us reimagine what our working world and its transportation needs can be. Summarized from “Private Versus Shared, Automated Electric Vehicles for U.S. Personal Mobility: Energy Use, Greenhouse Gas Emissions, Grid Integration, and Cost Impact” by Colin J. R. Sheppard, Alan T. Jenn, Jeffery B. Greenblatt, Gordon S. Bauer, and Brian F. Gerke, Environmental Science & Technology 55, no. 5 (March 2, 2021): 3229–39.
