Location-Based Services Data is Better than Cellular for Transportation – and Especially for Rural Areas
It’s undeniable that “Smart Cities” are getting all the buzz these days, especially when it comes to using Big Data for transportation. But it’s not right to leave rural communities out of the conversation. In fact, rural communities stand to reap the same benefits from better travel behavior data as densely populated areas – if not more.
That’s why it’s so upsetting for me to hear this type of comment at industry conferences: “Big Data sounds great. But I know it won’t work in my rural county. There’s not enough coverage.” That’s outdated thinking, plain and simple. It may have been true just a few years ago, but “Big Data” – AKA the billions of location records created by mobile devices every month – is a fast-growing, continually improving resource. With the rise of Location-Based Services (LBS) for smart phones in particular, we’ve seen an explosion of geospatial data sets with excellent coverage in rural areas.
As a Virginia native with family and friends across the many rural areas of the state, this issue hits close to home. I know from our data and my personal experience that rural drivers drive many more miles per day on average than urban drivers. We owe it to these communities to plan transportation systems that account for their unique travel behaviors.
To do that, rural planners need the up-to-date, comprehensive, and precise travel data that is only available from mobile devices. So in this blog post, I’m going to show that Big Data analytics for transportation are in fact widely available and extremely useful for rural areas.
It all starts with a new type of “Big Data” for mobile devices. With the increased adoption of smart phones and of Location-Based Services by smart phone users, there is much larger volume of geospatial data covering rural areas than ever before. That’s made a huge impact on the ability of Big Data analytics providers like StreetLight Data to provide travel pattern data for these regions.
How Location-Based Services Data Works
LBS data creates spatial readings using a variety of different techniques. This has many positive impacts, but one of the less obvious ones is excellent coverage in rural areas. LBS data sidesteps the coverage gaps that are regularly found in cellular tower data sets by pulling in records from all available carriers, and by using a variety of different sources including GPS, WiFi proximity, aGPS, Bluetooth proximity, and cellular triangulation.
In fact, LBS data has virtually no systemic coverage gaps, which means that it is excellent for rural areas. Cellular tower data is usually dependent on one carrier, so it can have systemic coverage gaps in areas where that carrier has no tower coverage. In some less populated areas, a wireless provider’s user may be able to make a call, but only because that provider is actually partnering with another carriers’ towers. In both of these cases, the cellular carrier will not be able to provide tower data for mobility analytics.
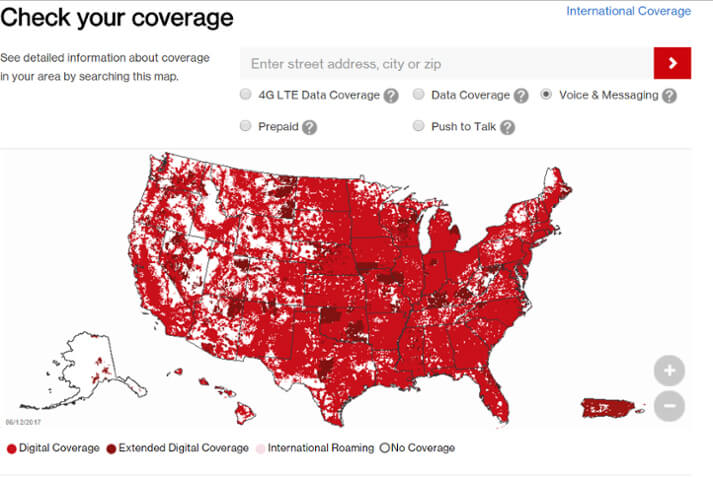
Click here for a breakdown of different carriers’ coverage in the US, and see below for screenshot of Verizon’s interactive coverage map. Note that even for the nation’s biggest carrier, there are major holes across the West, Northeast, and West Virginia.


Figure 1: As you can see in the heat hap above, even the telecom behemoth Verizon has coverage gaps. Visit Verizon’s website to explore coverage areas for the different services this carrier provides: http://vzwmap.verizonwireless.com/dotcom/coveragelocator/default.aspx?zip
LBS data avoids this problem in two important ways:
- LBS Data are Carrier-Neutral
LBS data are created by smart phones app that delivers LBS services – think shopping, dating, and weather apps. They are not created by a cellular carrier. These smart phone apps are also always available on all cellular carriers. Practically speaking, that means our data comes devices on all the four major (and all the minor!) carriers’ networks in the US. Thus, LBS data avoids the problem of gaps caused by one carrier having no coverage, or by “piggybacking” on other carriers’ towers.
2. LBS Apps Use Multiple Location Technologies
LBS apps determine a device’s location by using the most precise locational technology nearby that requires the least amount of battery power. If the device user has the GPS chip fired up, the app will use the GPS chip. If the device is near WiFi or Bluetooth sensors, the LBS data will use them to locate the phone. Of course, aGPS and cellular tower triangulation can also be used in a pinch. Of these, GPS is globally available with no coverage gaps, and WiFi/Bluetooth/aGPS sensing all happen independently of cellular tower coverage. (By the way, our GPS data from INRIX shares this benefit.)
The result of these two factors is that coverage is everywhere, even rural areas. Rural areas still have a lot of mobility, and typically longer trips. Plus, taking measurements in more remote rural areas can be much more expensive than taking the same measurements in denser areas. Ultimately, using Big Data for rural mobility analytics may have one of the biggest ROIs.
Testing the Coverage of LBS Data: Our Results
Next, let’s prove this hypothesis. To show clients in rural areas that Big Data will work for them, I normally ask them to describe the most rural road or town in their district. Then, I run some test analytics on our StreetLight InSight® platform, which transforms Big Data from mobile devices into travel pattern analytics.
For this blog post, we ran StreetLight InSight analyses in the centers of four of the least densely populated counties in America*:
- Loving County, Texas – The Center is Mentone with Population of ~100.
- Garfield County, Montana – The Center is Jordan Montana with Population of 343.
- Eureka County, Nevada – The Center is Eureka with Population of 610.
- Daniels County, Montana – The Center is Scobey with Population of 1017.
Our LBS data sets cover all four of these extremely rural centers, as shown in the figures below. In addition, we ran select link analyses using GPS data on three rural or canyon areas in these counties with the same positive results.
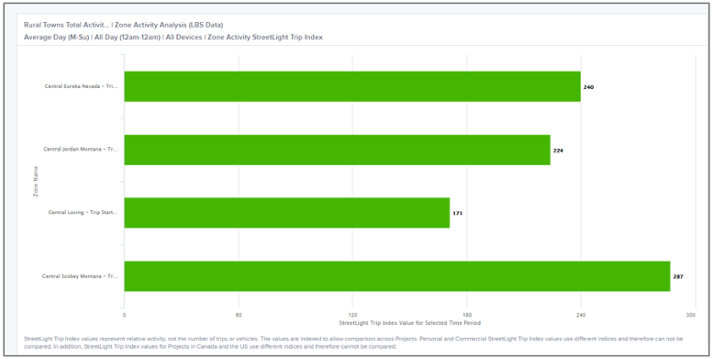
First, we ran a Zone Activity analysis for all for the county’s centers. This type of analysis looks at the relative volume of trips that stop in, start in, or pass through a geography, or “Zone.” StreetLight InSight delivered results for all four areas, and that means we have coverage with LBS data in those locations. See Figure 1 below for a comparison of trip volume for the four counter centers.
Figure 2: This StreetLight InSight chart reveals that LBS data is available in all four rural county centers. Central Scobey, Montana has the greatest volume of travel activity. That meets our expectations because Scobey also has the largest population of the four we analyzed.
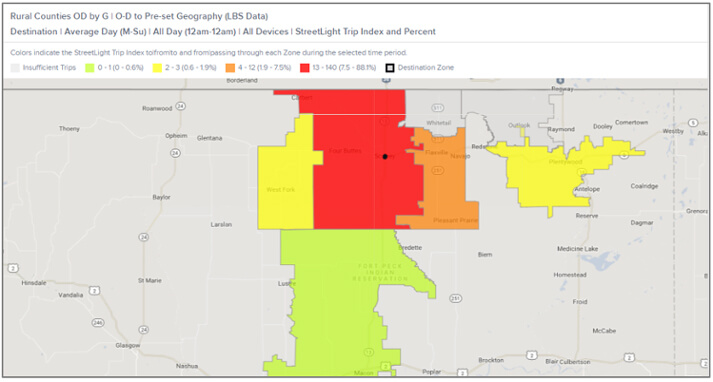
We decided to dig a little deeper by doing an origin-destination analysis for each of these rural centers. You can see a heat map of our results for Central Scobey Montana in Figure 3 below.

Figure 3: This StreetLight InSight heat map shows the origins of trips that end in Scobey, Montana. The darker a region is shaded, the greater volume of trips begin there.
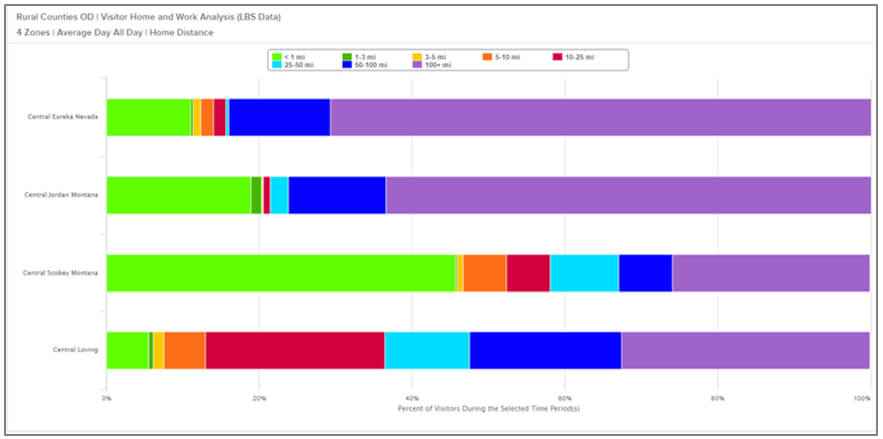
Next, we ran a “Visitor Home and Work Analysis” in StreetLight InSight to get a better understanding of where the people visiting these communities typically spend the time. This type of analysis shows the likely home and work locations of the groups of people that visit an area.
The results showed that all four rural towns had significant activity from people who live many miles away (see Figure 3 below). These may be visitors who are stopping by to see famous vistas. Eureka, Nevada, for example, has a population ~610, but it is a beautiful spot with “stunning mountain views” according to the county’s website.
Figure 3: This StreetLight InSight chart shows the distance from home of visitors to the four rural county centers.
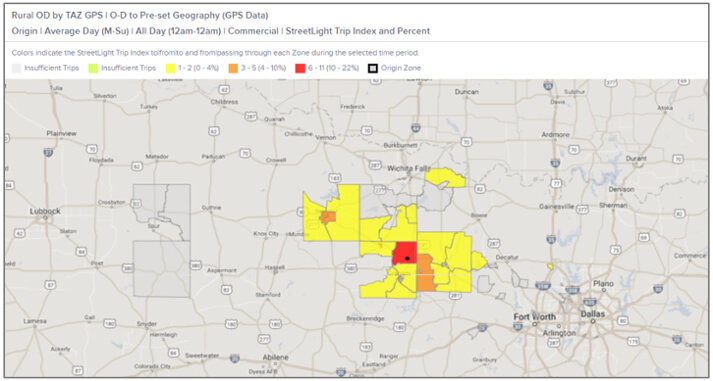
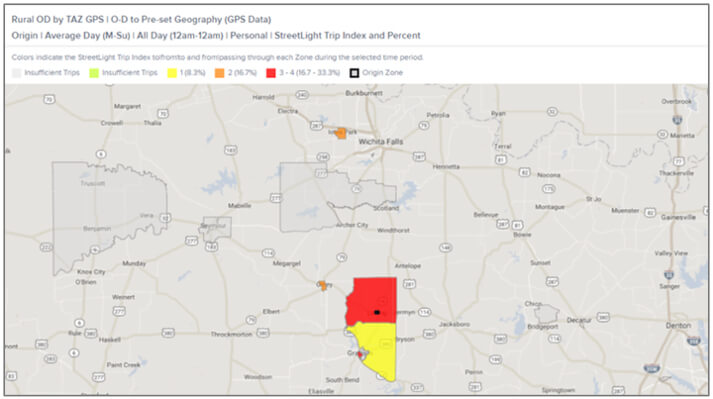
In addition, many of these towns are conveniently located for truckers to stop and eat and rest. We developed this “trucker” hypothesis by comparing the O-D by TAZ output for commercial trucks (see Figure 4a), which is very rich, to the more sparse O-D- by TAZ output for personal travel (see Figure 4b).
Figure 4a: This StreetLight InSight heat map shows the destinations commercial truck trips that originate in Loving County, Texas. It was developed using navigation-GPS data from our partner INRIX, as was the heat map below.
Figure 4b: This StreetLight InSight heat map shows the destinations of personal trips that originate in Loving County, Texas.
Putting It All Together
As we’ve shown with this analysis, rural areas can certainly benefit from Big Data, and the data is definitely available – but only if planners are selective about the specific resources they use. Instead of relying on cellular tower data, planners in rural areas can get more value from LBS and GPS data sources.
